GeoAstro – Statistical Module
A Statistical Software for the Evaluation of Astrological Data
By Manuel da Costa — GeoAstro
GeoAstro is a statistical analysis software applied to astrological data.
Its objective is simple and clearly defined:
to assess whether the astrological results observed within a population group can reasonably be attributed to chance, or whether they display a statistically improbable pattern.
In other words, GeoAstro aims to test statistical hypotheses on population groups, based on astrological data (scientists, artists, athletes, etc.).
The Fundamental Principle: Comparing Observed Results with Chance
When a planetary or zodiacal dominance is observed within a given group (for example, Formula One drivers, chess players, or mathematicians), a key question arises:
are these results specific to that group, or could they occur randomly in any population sample?
GeoAstro addresses this question by implementing a systematic comparison between:
- the results actually observed in the group under study;
- the results expected by chance, calculated through random simulations.
In this respect, GeoAstro relies on an approach inspired by statistical methods commonly used across many fields of academic and university research, including the social sciences, experimental psychology, epidemiology, and economics.
Step 1 — Building a Statistical Reference Model
Random Permutation of the Data
To construct a reliable statistical reference, GeoAstro uses a permutation-based simulation method:
- the dates and times of birth of the individuals in the group are randomly shuffled;
- this process is repeated a large number of times (typically 1,000 or 10,000 simulations);
- each simulation generates a fictitious group that is statistically comparable to the real group, but without any intentional astrological structure.
In this way, the software estimates the probability for each element of the astrological chart to appear as dominant, sub-dominant, or non-dominant, based on the same birth data redistributed at random.
This procedure is based on permutation tests, a class of nonparametric methods widely used in modern statistics. Such approaches are commonly employed across many research fields — including biostatistics, neuroscience, machine learning, and environmental sciences — when it is preferable to estimate the distribution under the null hypothesis empirically rather than assuming a parametric form.
In this framework, the reported probabilities correspond to empirical p-values obtained from repeated random simulations. Consequently, all inferences are conditional on the null hypothesis and on the adopted permutation scheme.
Step 2 — Computing the Reference Distributions
Based on the thousands of simulated groups, GeoAstro computes, for each astrological element:
- the normal distributions expected by chance;
- the mean values and statistical dispersion.
These calculations are performed for the different components of an astrological chart, including:
- planets;
- RET planetary families;
- zodiac signs;
- zodiac families;
- houses and local-sphere zones;
- planetary aspects.
The Central Criterion: Mean Hierarchical Rank
GeoAstro relies on a graded approach to astrological hierarchy:
- Each planet is ranked from 1 to 10 according to its hierarchical position in the chart.
- Each RET planetary family is ranked from 1 to 8.
- Each zodiac sign is ranked from 1 to 12.
- And so on, depending on the category analyzed.
The software then computes:
- the observed mean rank for each planet, sign, or category within the group under study;
- the expected mean rank obtained from the randomly generated groups.
This hierarchical mean-rank approach enables a graded and precise analysis, progressively distinguishing strong, intermediate, and weak elements within the astrological profiles of the analyzed group.
Step 3 — Computing Statistical Probabilities
GeoAstro compares the observed results with the distributions obtained through simulation:
- for each planet, sign, or category, it calculates the probability that a random group would produce a mean rank equal to or more atypical than the one observed.
In simple terms:
the lower this probability, the less likely the result can be attributed to chance.
Statistical Interpretation of the Results
In statistics, a conventional significance threshold is commonly used:
- 5 % (p < 0.05)
When the probability falls below this 5% threshold:
- the result is considered statistically unlikely;
- it is judged too improbable to be explained by chance alone.
Within the GeoAstro framework, this means that the group under study exhibits an astrological configuration that differs significantly from what would be expected in a random sample.
In other words, the result is considered too atypical to be attributed to chance.
Highlighting statistically significant results
In the result tables produced by GeoAstro, values corresponding to a probability less than or equal to 5% (p ≤ 0.05) are displayed in bold, in order to visually highlight statistically atypical results.
This graphical convention has no interpretative value in itself; its sole purpose is to facilitate the rapid identification of statistically unlikely deviations relative to the random reference distribution.
Methodological Positioning of GeoAstro
- Filiation
GeoAstro follows in the continuity of the AstroStat module developed by Julien Rouger, who is also a conditionalist astrologer.
- Methodological choice
After several years of using this module, GeoAstro was designed on the basis of a distinct methodological choice, consisting in retaining only those astrological elements that are statistically relevant.
- Statistical signal and noise
In statistical analysis, an excessive level of detail tends to generate statistical noise by multiplying random variations and false signals, to the detriment of effects that are genuinely measurable. As a result, meaningful outcomes become more difficult to identify.
- Selective approach
Whereas the AstroStat module produced a very large volume of detailed results, GeoAstro adopts a deliberately selective approach, focusing on those chart elements most likely to yield statistically significant deviations.
This orientation is based on the assumption that only genuinely predominant elements within an astrological chart can give rise to a measurable statistical effect.
Using the GeoAstro Software
General Interface Structure
The GeoAstro interface is organized into several tabs, each corresponding to a specific type of statistical processing applied to astrological data. This structure clearly separates calculation functions, data preparation, and result comparison.
The main available tabs are as follows:
- Analysis
The main tab of the software, allowing users to run statistical calculations on a population cohort based on an input data file.
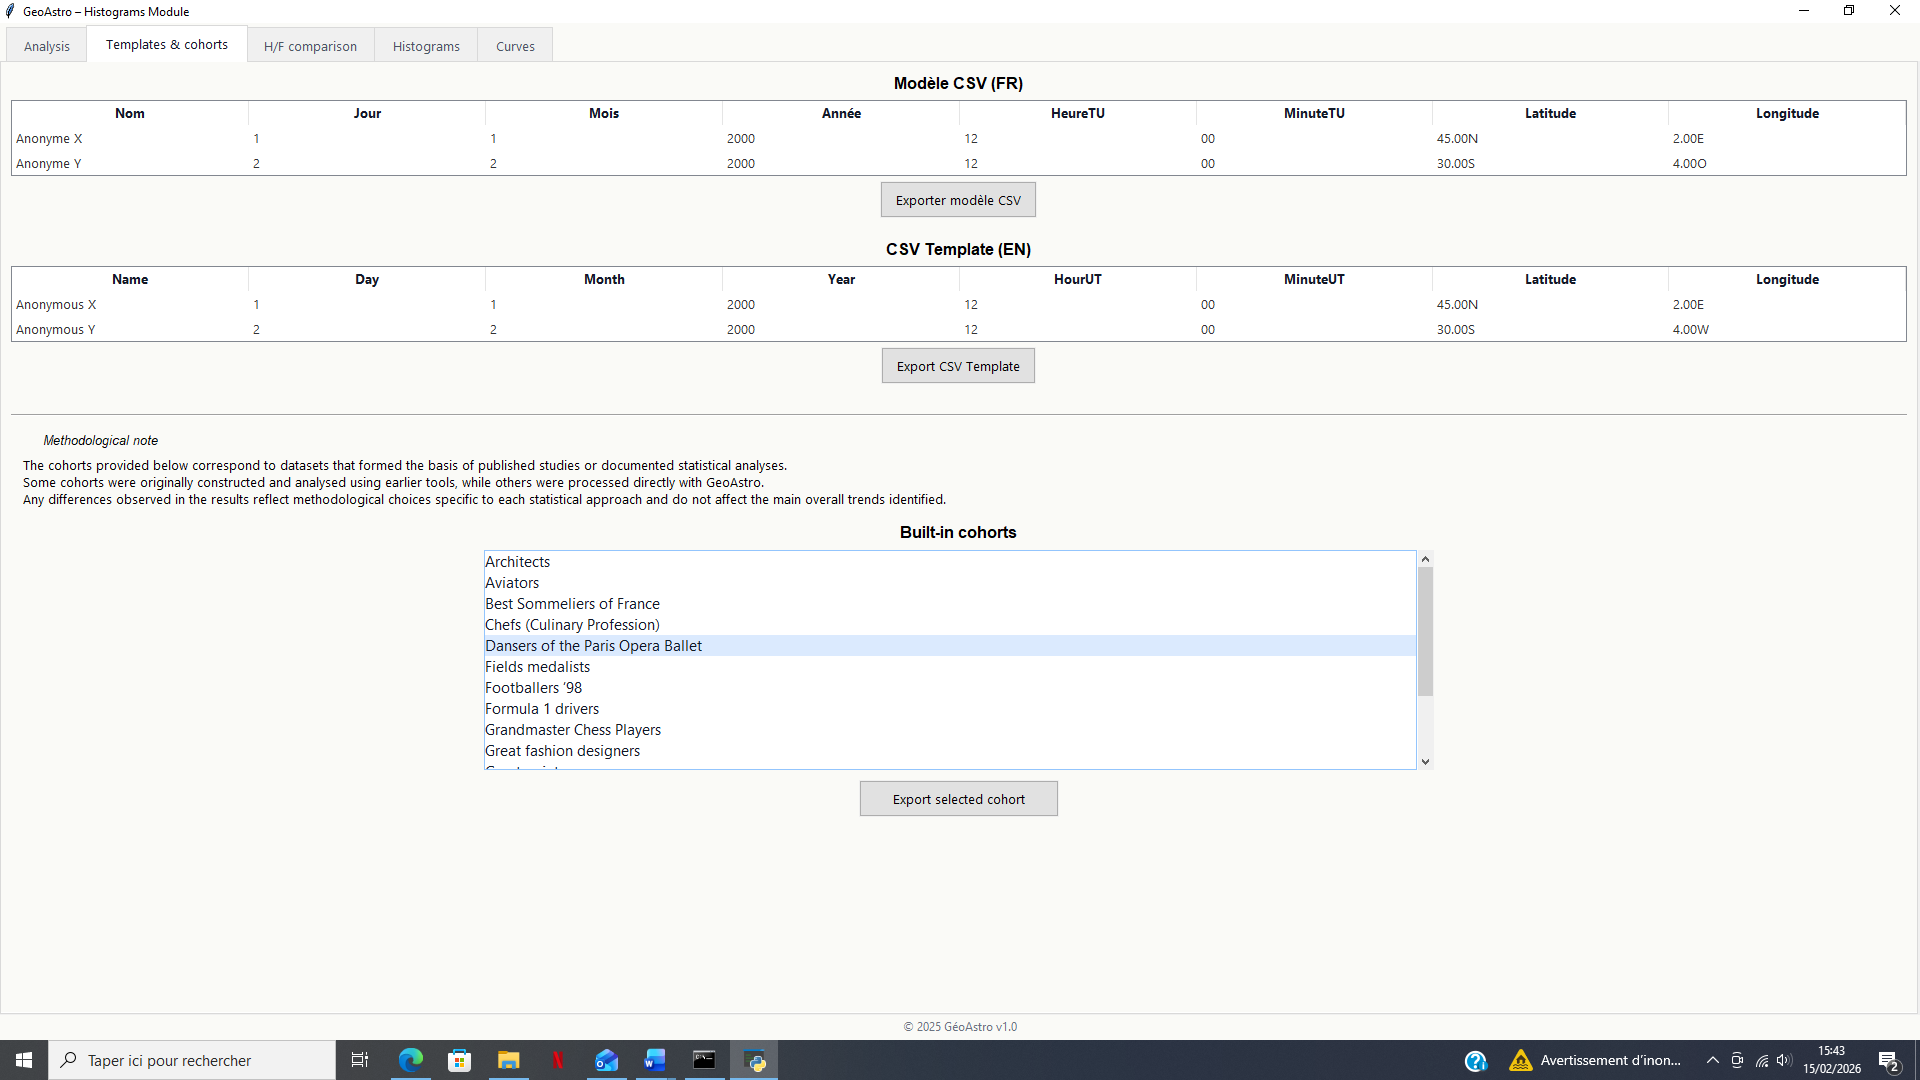
- CSV Templates
A tab providing input file templates designed to ensure a data structure compatible with the GeoAstro calculation engine.
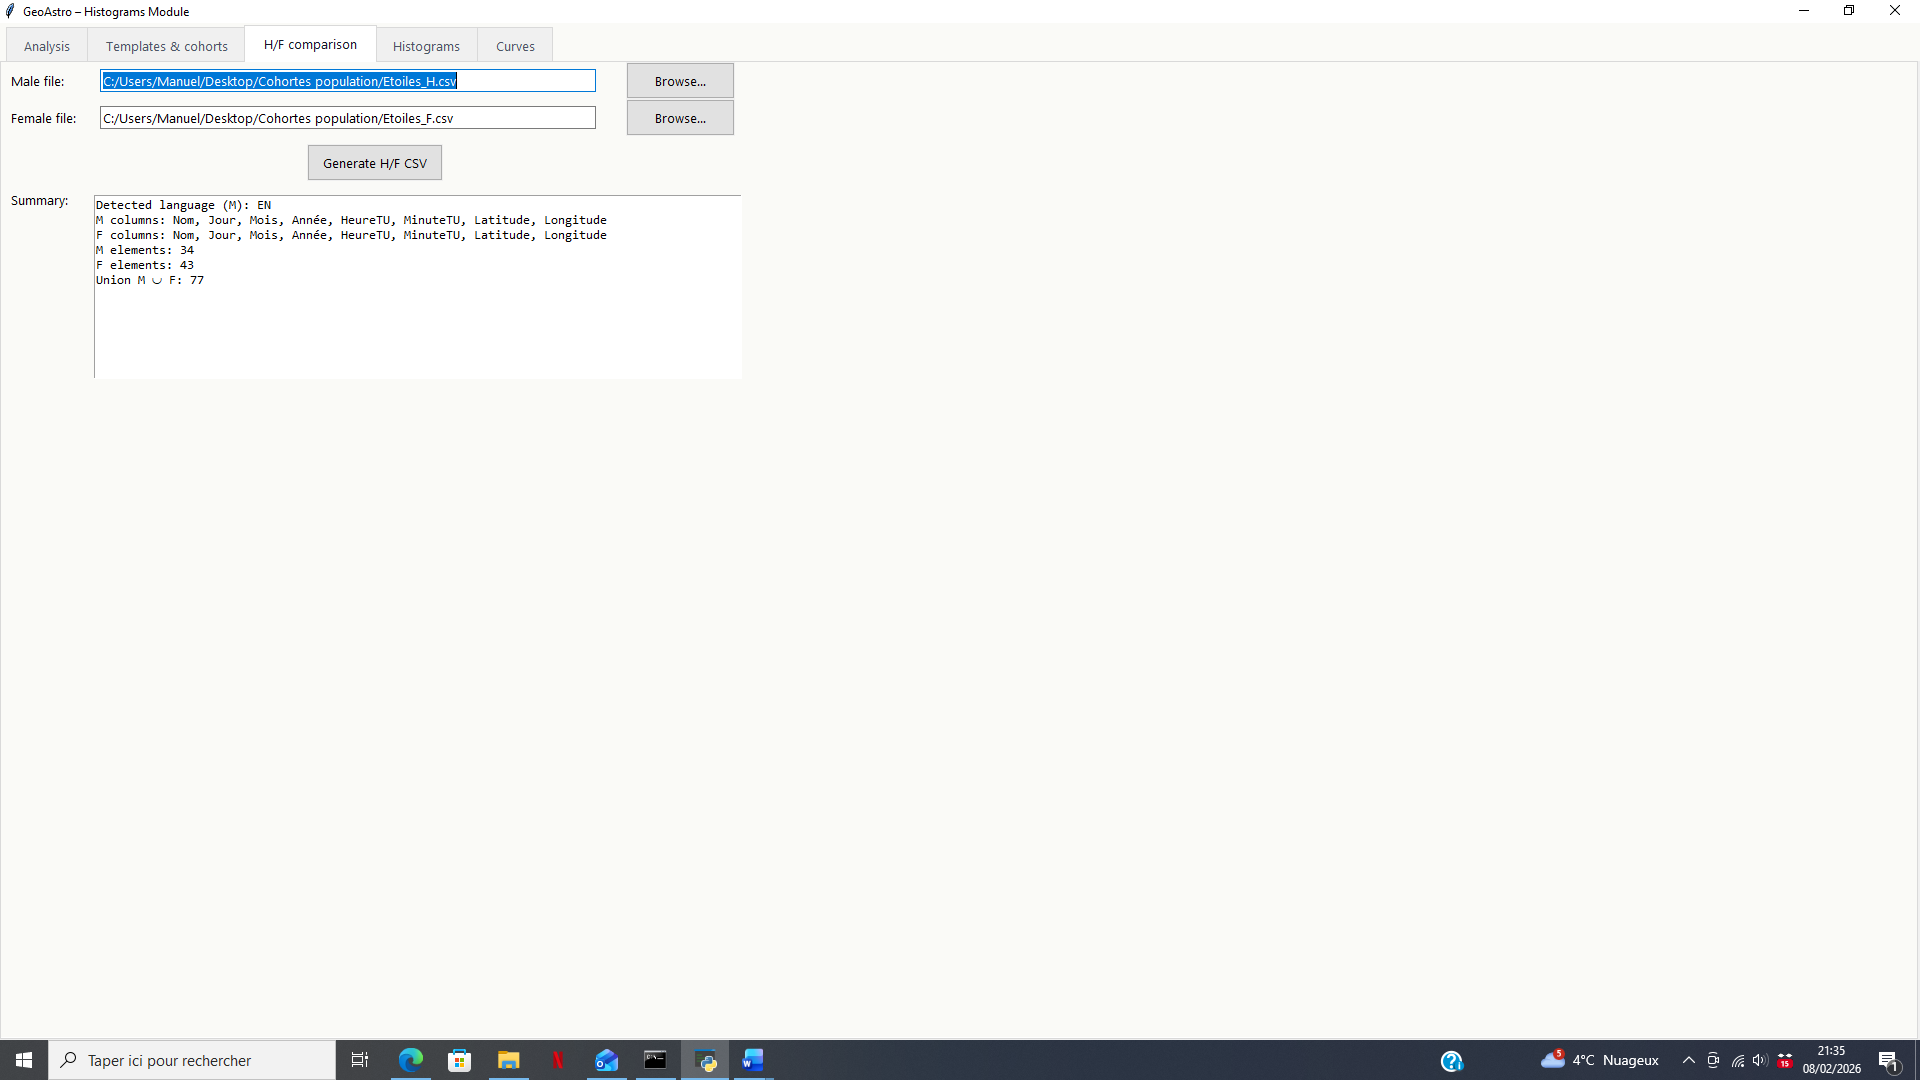
- Male/Female Comparison
A tab dedicated to statistical comparisons between male and female populations, when the available data allow for such analysis.
Calculation Parameters
Before running a statistical analysis, the user defines several parameters:
- Data file selection
The data are imported as a CSV file containing the information required for astrological and statistical analysis.
- Number of permutations
The number of random simulations can be set to 1,000 or 10,000, depending on the desired level of precision.
- Display language
The interface and results can be displayed in French or English.
Once these parameters are defined, the statistical calculation is launched using the dedicated button. A progress bar allows the user to monitor the advancement of the process. The results can then be exported in CSV format.
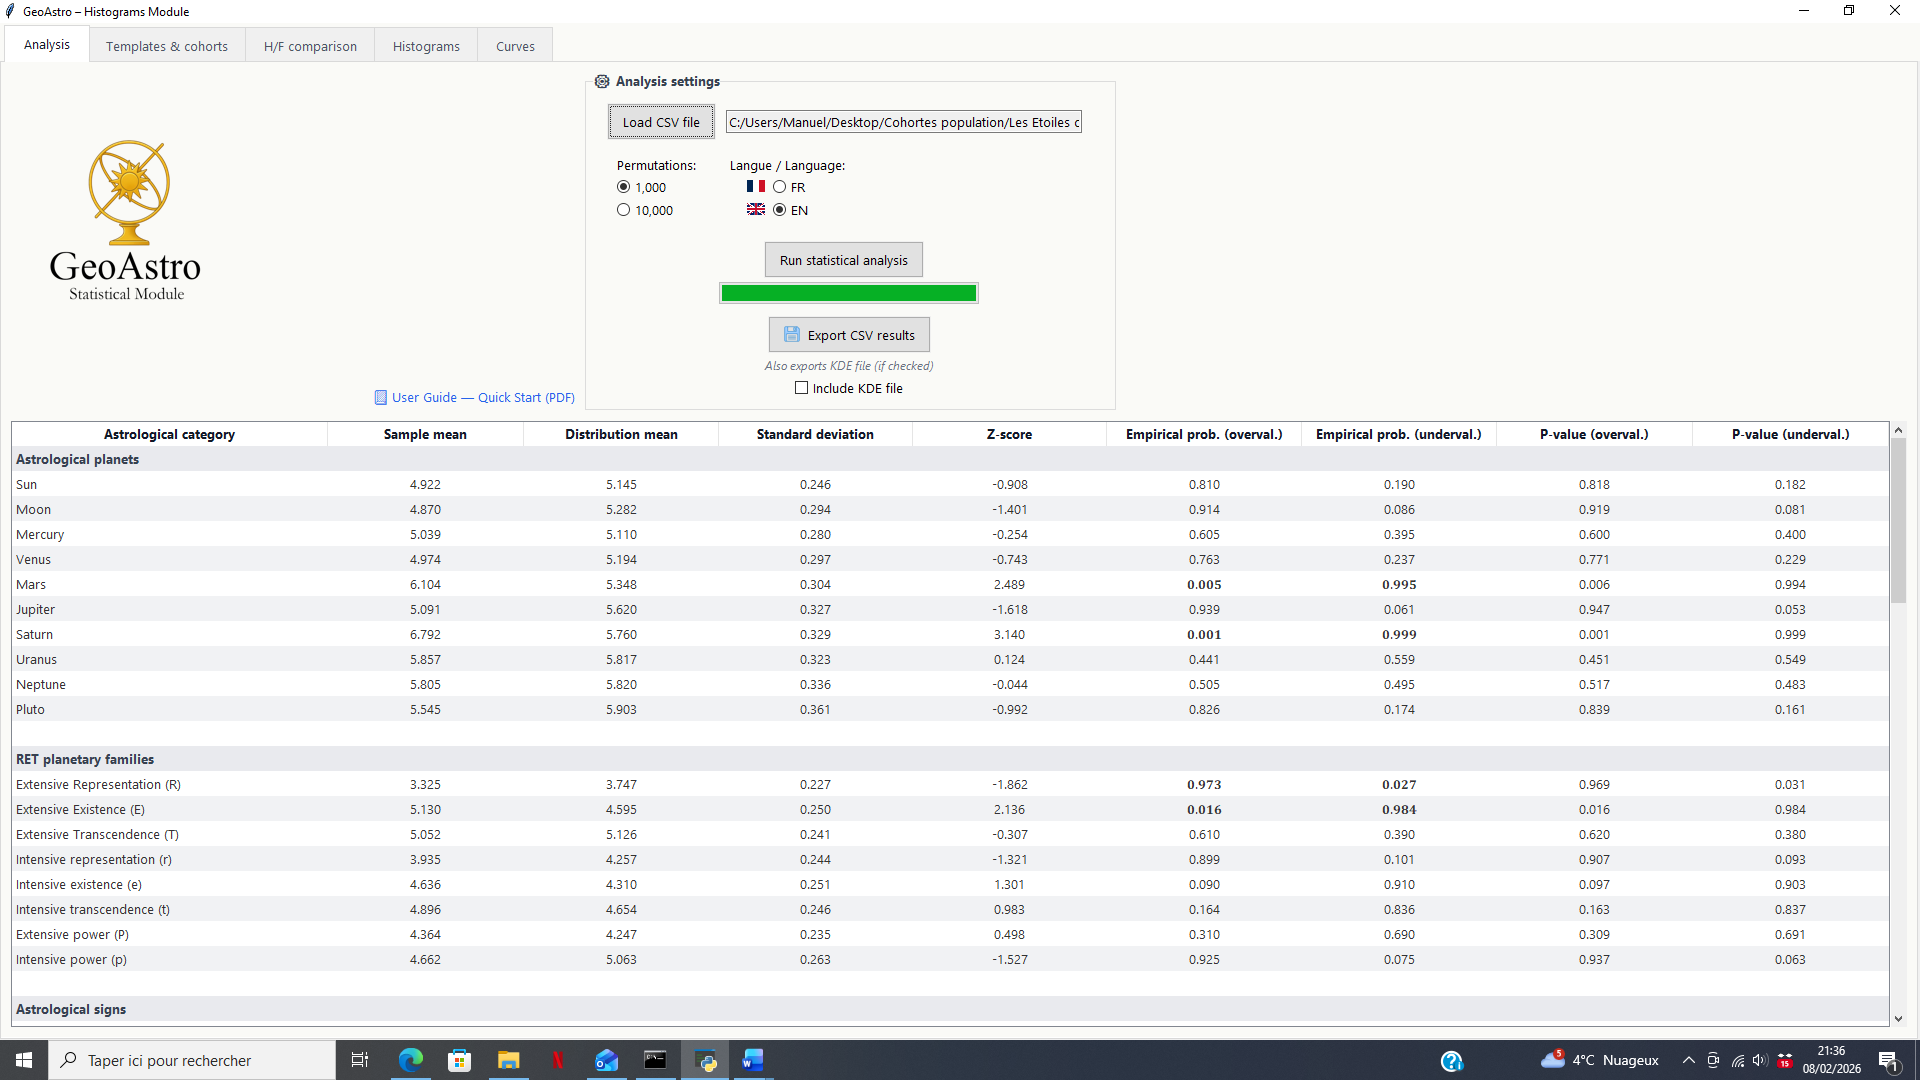
Presentation of Statistical Results
The results are displayed in the form of a summary table.
Each row corresponds to an analyzed astrological element (planet, planetary family, sign, etc.), and each column represents a specific statistical indicator.
Meaning of the Table Columns
- Astrological category
Label of the analyzed entity (planet, RET family, zodiac sign, etc.).
- Sample mean
Mean value observed in the real data of the group under study.
- Distribution mean
Mean value derived from the null distribution obtained through random permutations.
- Standard deviation
Measure of the dispersion of the null distribution: the larger the standard deviation, the more widely the simulated values are spread around their mean.
- Z-score
Distance, expressed in units of standard deviation, between the observed value and the mean of the null distribution.
A value close to zero corresponds to an ordinary result; a high positive or negative value indicates an atypical result.
- Empirical probability (over-representation)
Frequency, across permutations, of a value at least as high as the observed value, indicating potential over-representation.
- Empirical probability (under-representation)
Frequency, across permutations, of a value at most as low as the observed value, indicating potential under-representation.
- P-value (over-representation)
Theoretical approximation of the probability of over-representation, calculated from the z-score (upper tail of the normal distribution).
- P-value (under-representation)
Theoretical approximation of the probability of under-representation, calculated from the z-score (lower tail of the normal distribution).
An Experimental Approach Applied to Astrology
GeoAstro is based on an experimental approach applied to astrology, grounded in a simple and reproducible logic:
- Observation of a phenomenon within a real population group;
- Simulation of this phenomenon by chance, using random permutations;
- Statistical comparison between the observed results and reference distributions;
- Evaluation of the probability that the observed results can be attributed to chance.
This approach makes it possible to transform empirical observations into measurable, quantified, and discussable results, consistent with the methodological standards of statistical research.
Within this framework, GeoAstro provides a standardized software environment dedicated to the computation and presentation of astro-statistical results on population groups, deliberately limiting itself to the production of objectifiable statistical indicators.
Through its reliance on random simulations, reference distributions, and explicit statistical criteria, GeoAstro represents an original tool in the field of contemporary statistical astrology, with no direct equivalent to date in the form of a dedicated, structured, and reproducible software solution.
Display and Visualization of Results
GeoAstro produces statistical results that can be exported in CSV format, and used by dedicated graphical modules for visualization in the form of histograms or distribution curves.
Two complementary modes of statistical result visualization are therefore provided. These modes are not intended to interpret the data, but to make the position of a result relative to a reference distribution readable, according to two distinct levels of analysis.
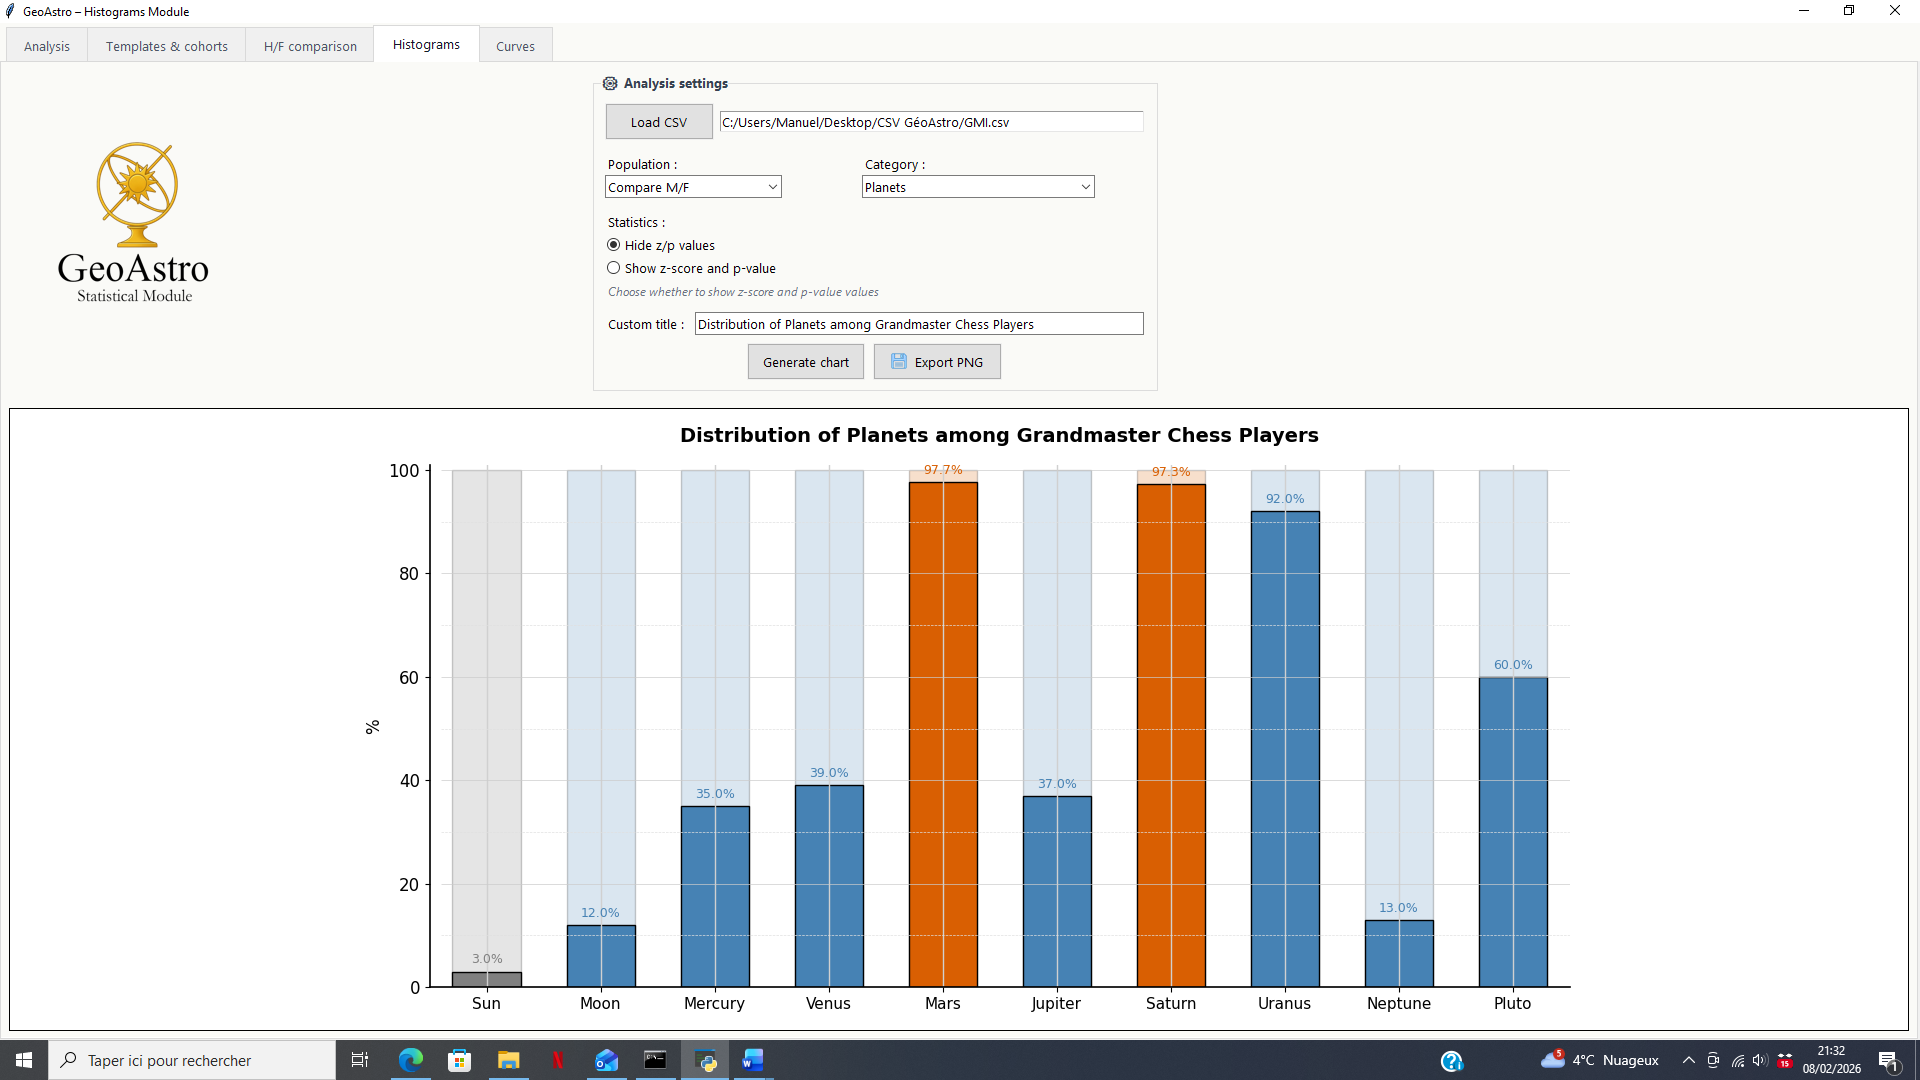
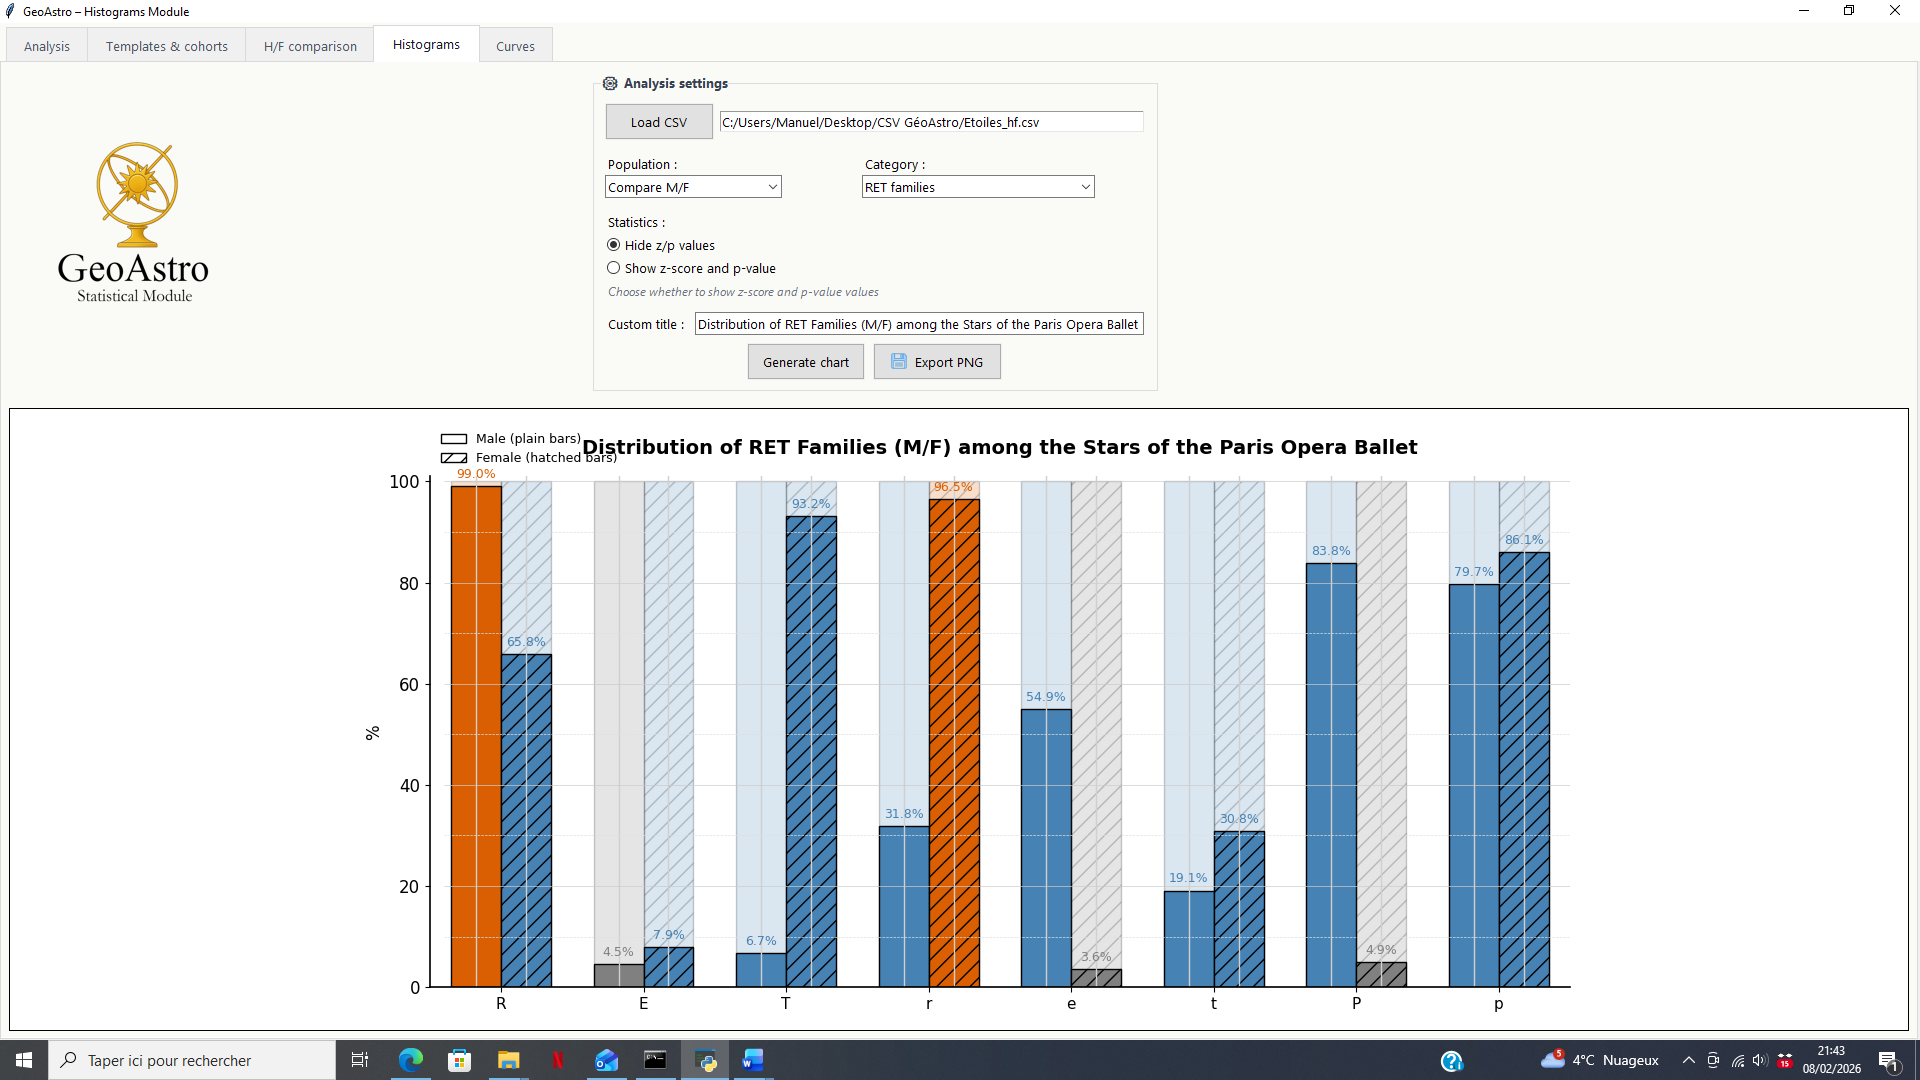
Global Display: Comparative Histograms
The first visualization mode is based on histograms, providing an overall view of the results for all analyzed astrological elements.
Each histogram represents:
- the observed distribution of astrological elements within the group under study;
- expressed as percentages;
- for a given category (planets, signs, families, etc.).
This display mode makes it possible to:
- quickly identify over- or under-represented elements;
- visually compare deviations across different astrological categories;
- obtain a synthetic overview of the trends within the analyzed group.
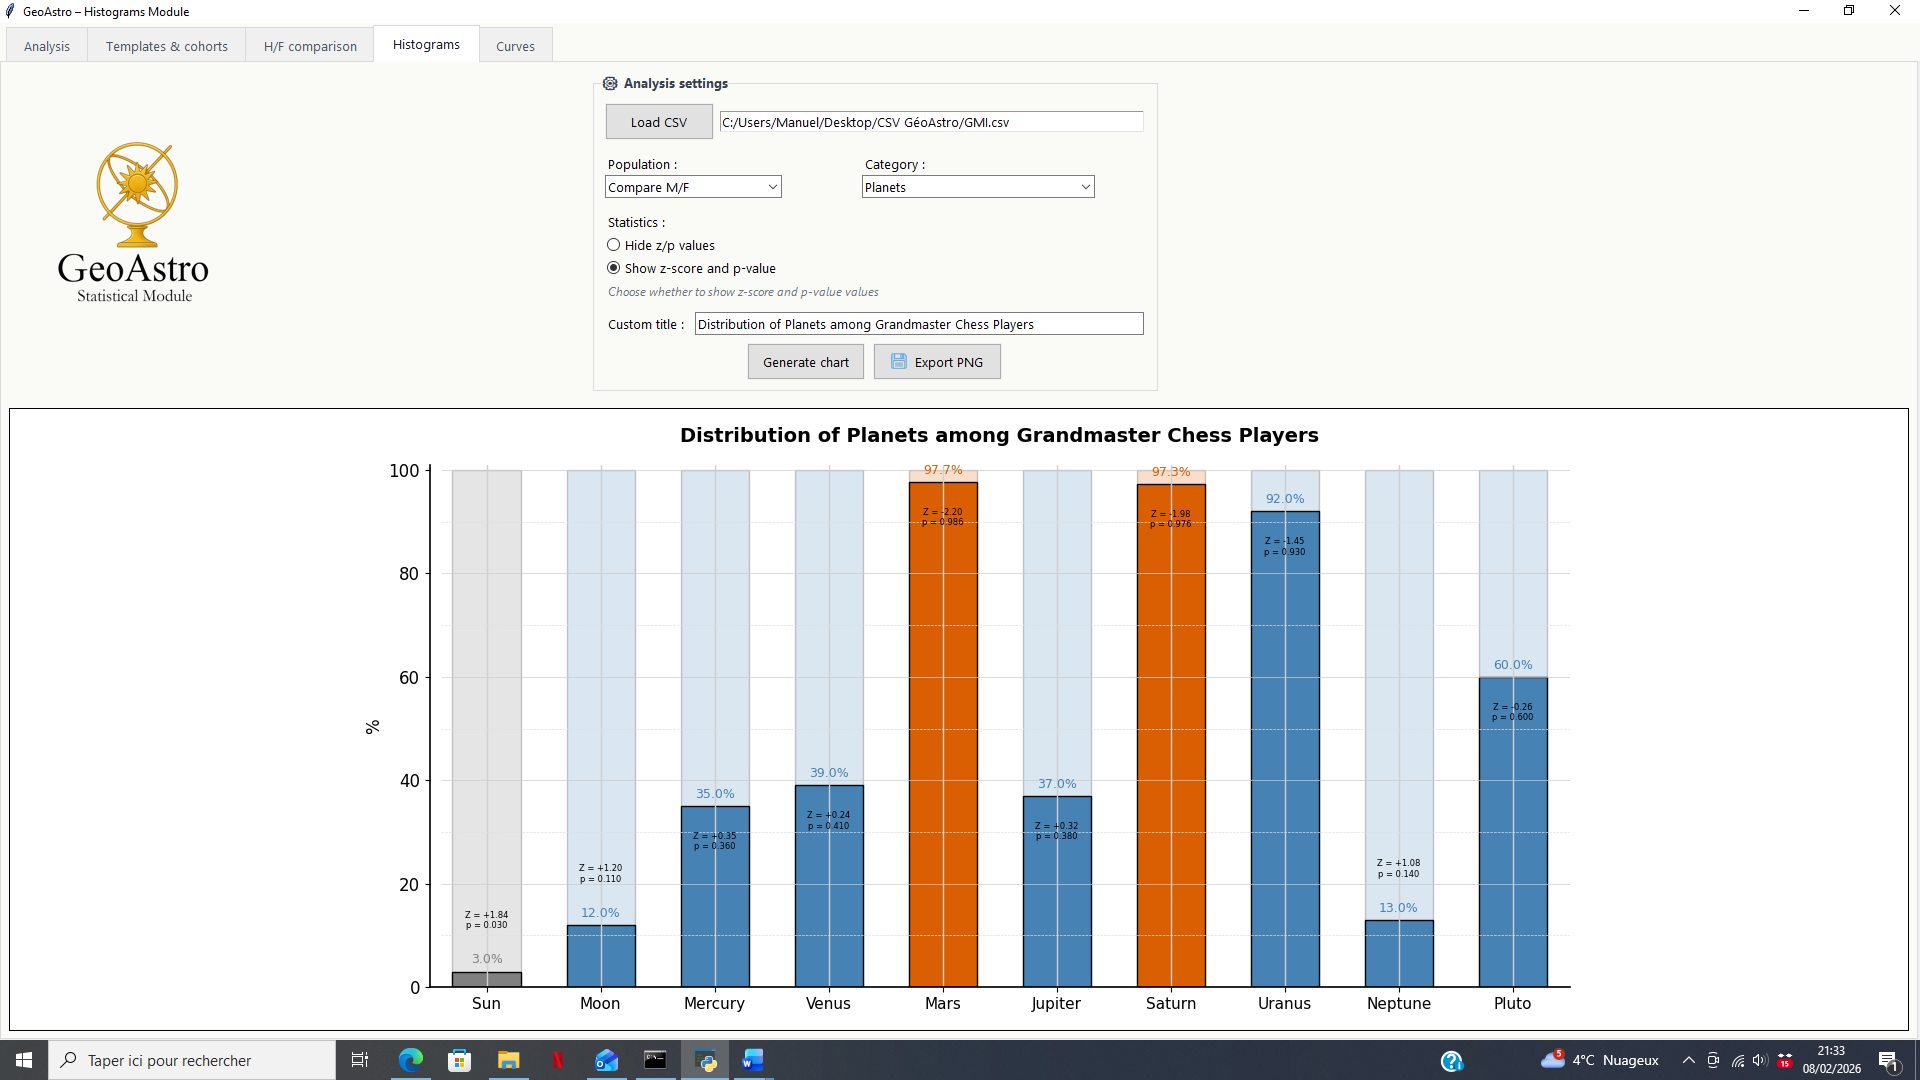
Depending on the selected options, the histogram may also display additional statistical indicators (z-score and p-value), allowing the observed deviations to be positioned relative to the reference distributions computed by the software.
This mode is primarily intended for a comparative and exploratory reading, at the scale of the group as a whole.
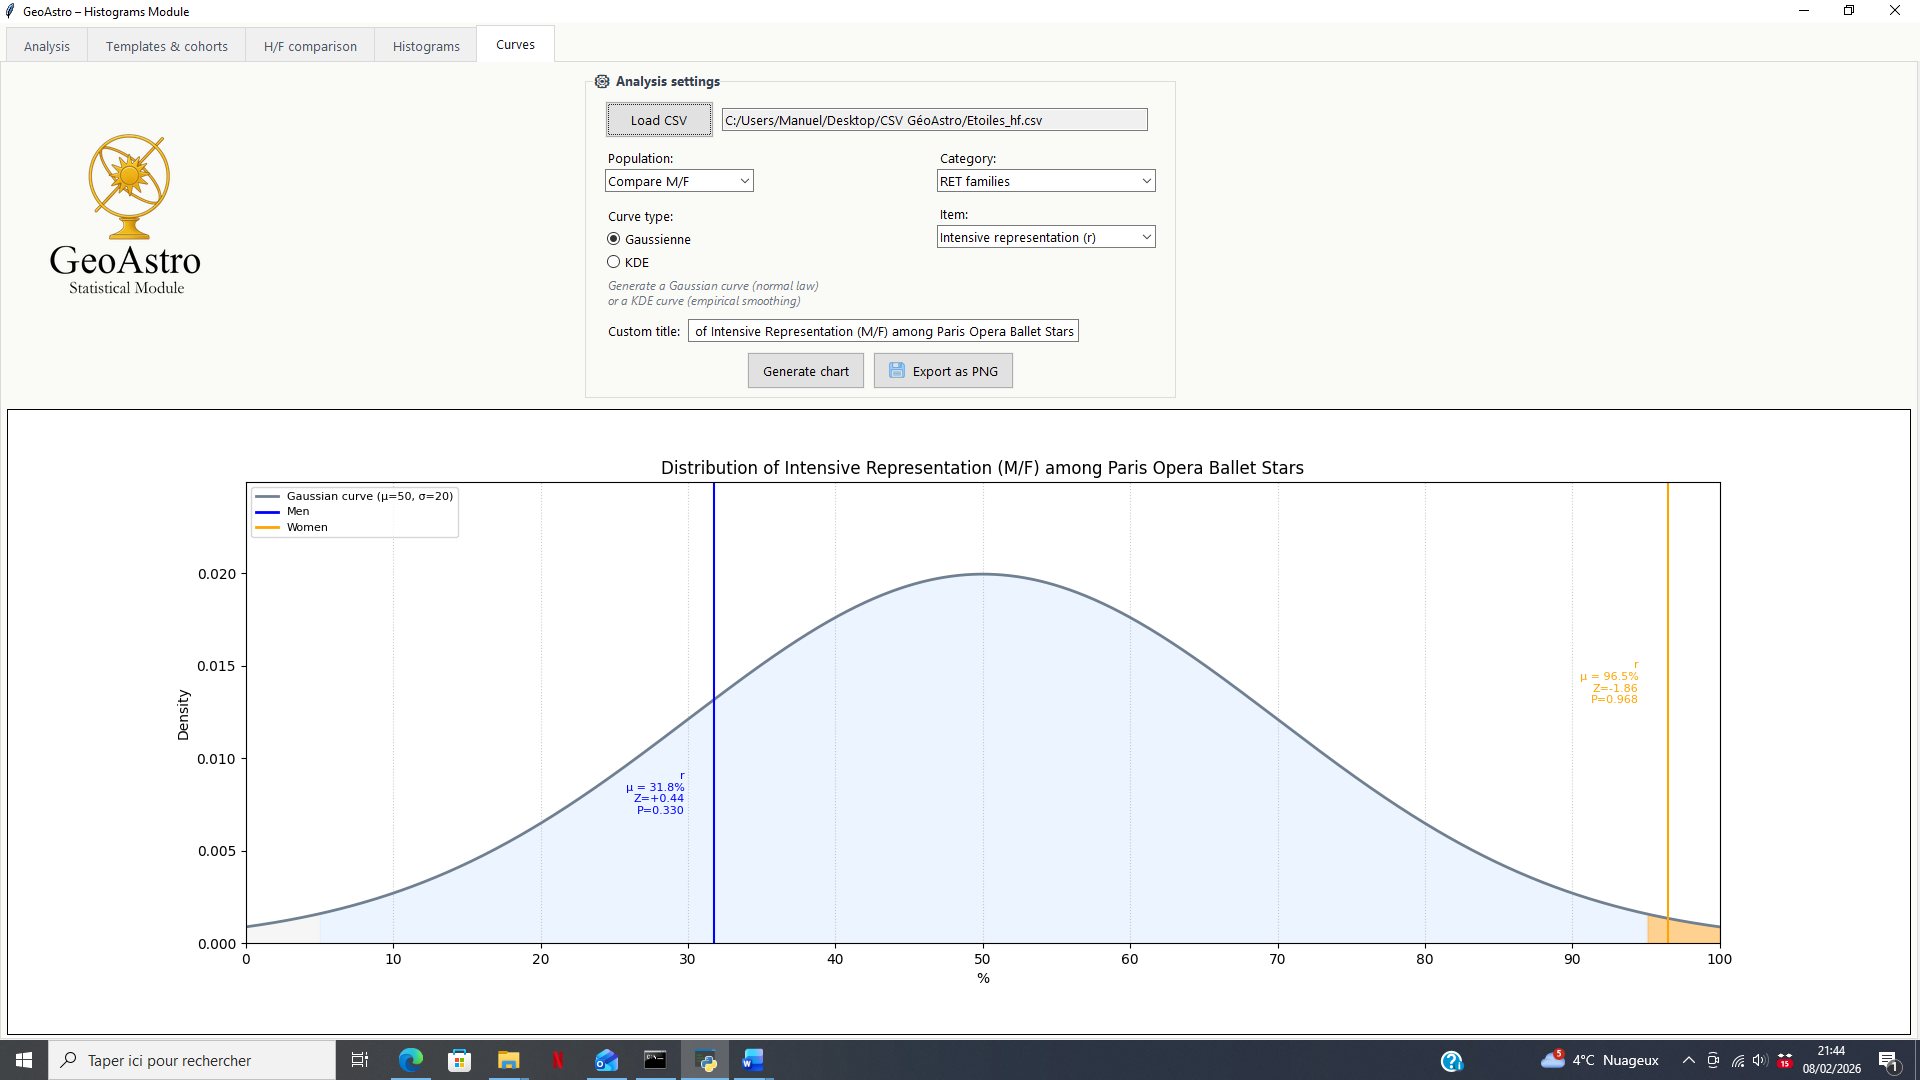
Individual Display: Distribution Curves
The second visualization mode is based on distribution curves, allowing for a more detailed and focused analysis of a specific astrological element.
Unlike histograms, which provide a global overview, this mode makes it possible to position a specific result within a statistical distribution.
Two types of curves are available:
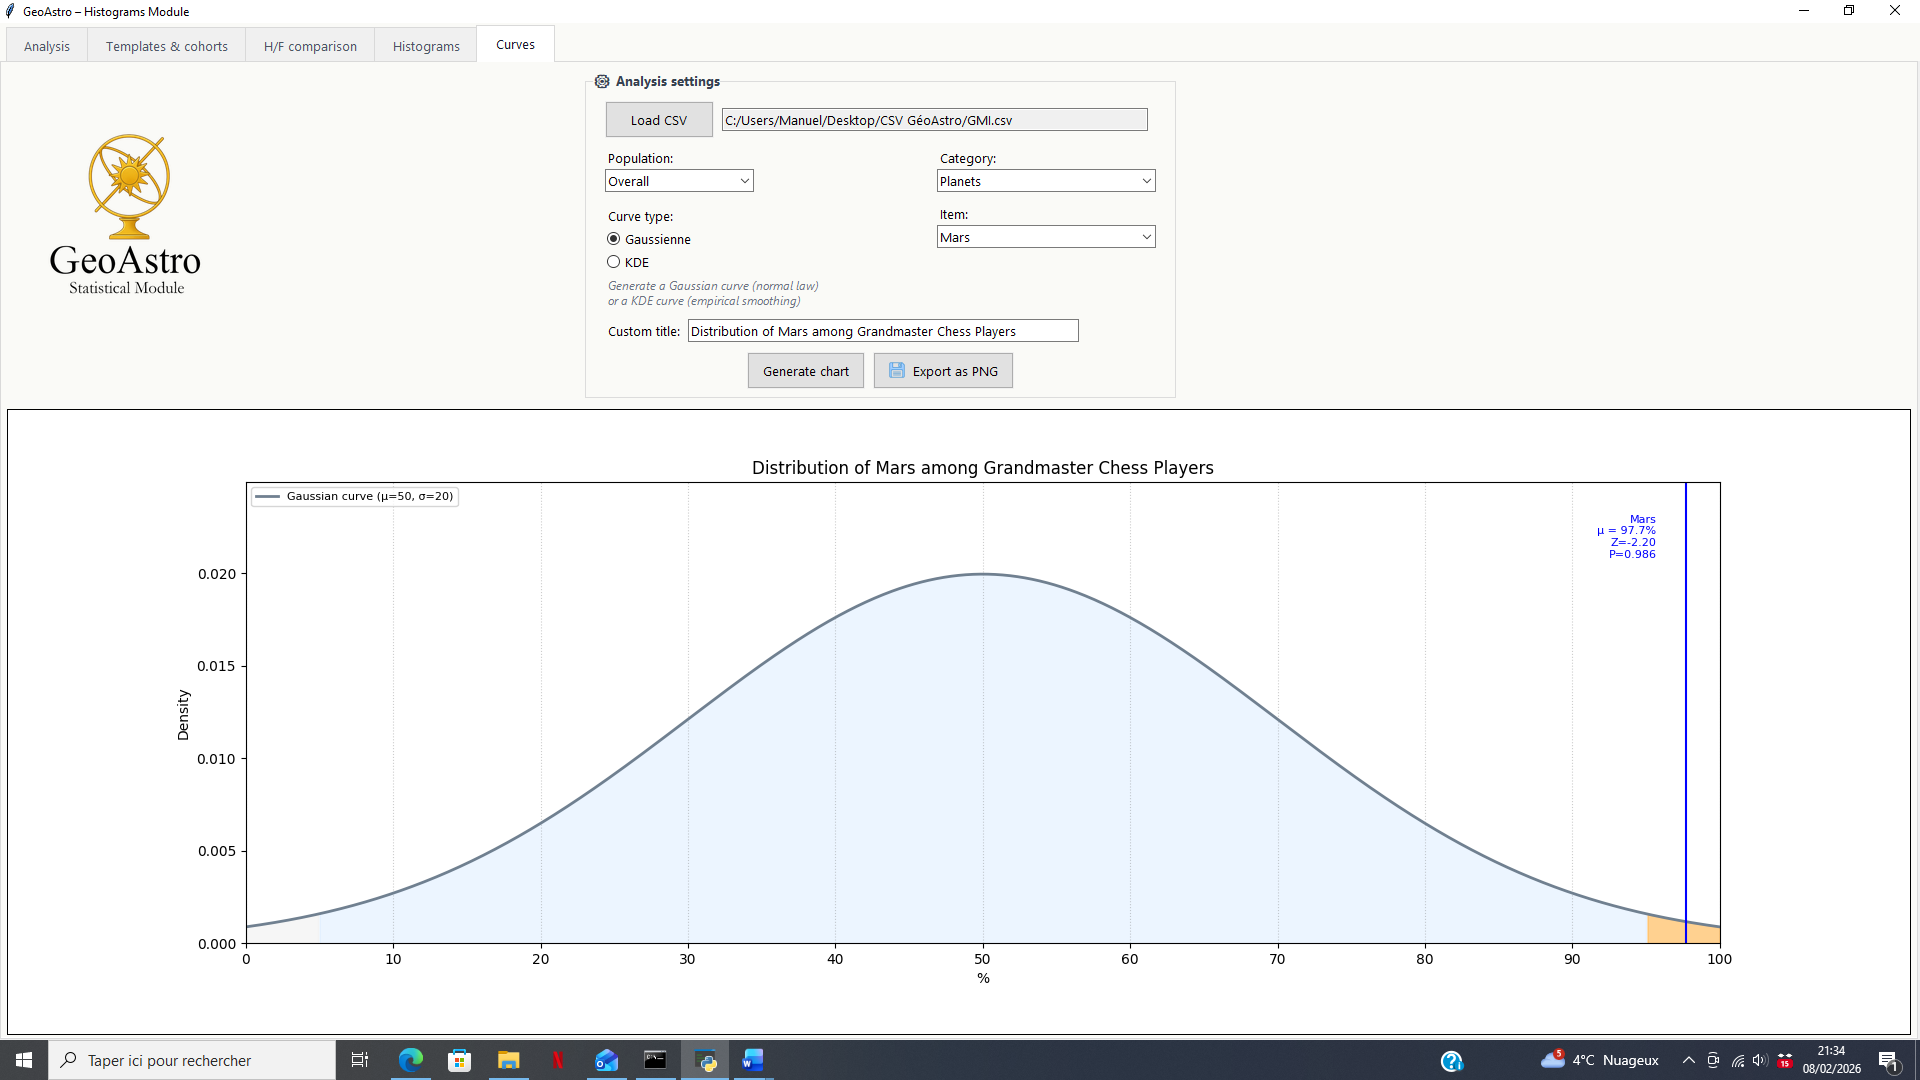
Gaussian Curve (Theoretical Distribution)
The Gaussian curve represents the theoretical distribution expected by chance, constructed from the calculated statistical parameters (mean and standard deviation).
This mode makes it possible to:
- locate the observed value relative to a reference normal distribution;
- visually display the z-score and the position of the result within the distribution;
- assess whether a result is ordinary or atypical.
The Gaussian curve thus corresponds to a theoretical approach, based on the assumption of a normal distribution.
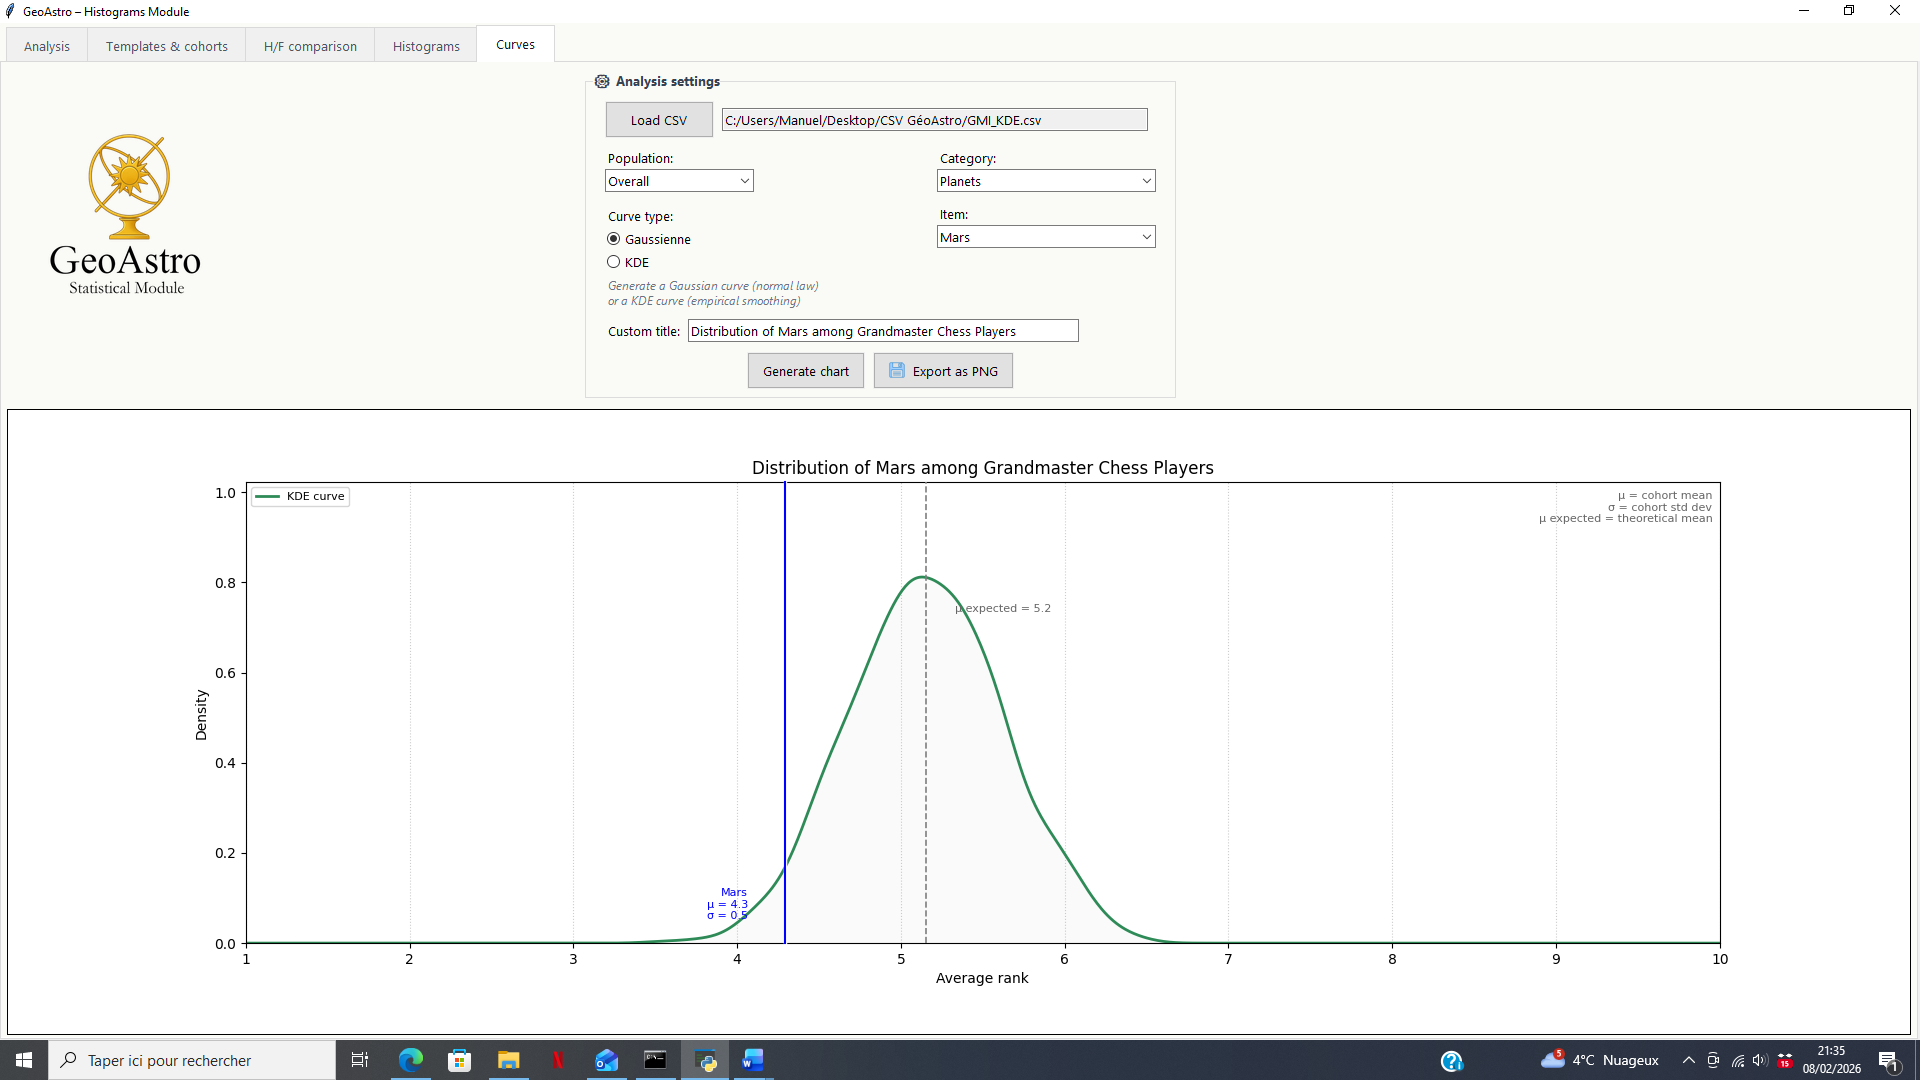
KDE Curve (Empirical Distribution)
The KDE (Kernel Density Estimation) curve represents the actual empirical distribution, directly grounded in the simulated results produced by the software.
This mode makes it possible to:
- visualize the true shape of the distribution derived from the simulated data;
- detect potential asymmetries or irregularities;
- dispense with the assumption of normality.
The KDE curve therefore provides a complementary empirical perspective, directly grounded in the simulated results produced by the software.
Complementarity of Visualization Modes
Histograms and distribution curves serve different but complementary purposes:
- histograms provide a synthetic and comparative overview of global trends;
- distribution curves allow for a precise examination of the position of a result relative to a reference distribution, whether theoretical or empirical.
By combining these two levels of visualization, GeoAstro enables a rigorous and graduated reading of statistical results, while fully respecting the distinction between calculation, visualization, and interpretation.
Conclusion of the Visualization Section
The visualization tools integrated into GeoAstro are designed to make complex statistical results accessible, without steering their interpretation. They serve as an aid for assessing deviations from chance, strictly within the experimental framework defined by the software.