AstroMap — General Overview
General Principles of AstroMap
AstroMap is an astrological calculation and visualization module.
Its purpose is to produce, from individual natal data, a structured hierarchy of chart elements based on the actual positions of celestial bodies in the local sphere and on an explicit, well-defined protocol.
AstroMap provides a structured and hierarchical reading of the individual chart. The interface is organized into successive tabs, each corresponding to a distinct logical stage in the astrological analysis.
General Interface Structure
AstroMap is built around six main tabs:
- Ecliptic Chart
- Domitude Chart
- RET and Planetary Hierarchy
- Transits
- Aspects
- Interpretation
Each tab corresponds to a specific function and forms part of a logical progression, moving from chart representation to hierarchical synthesis.
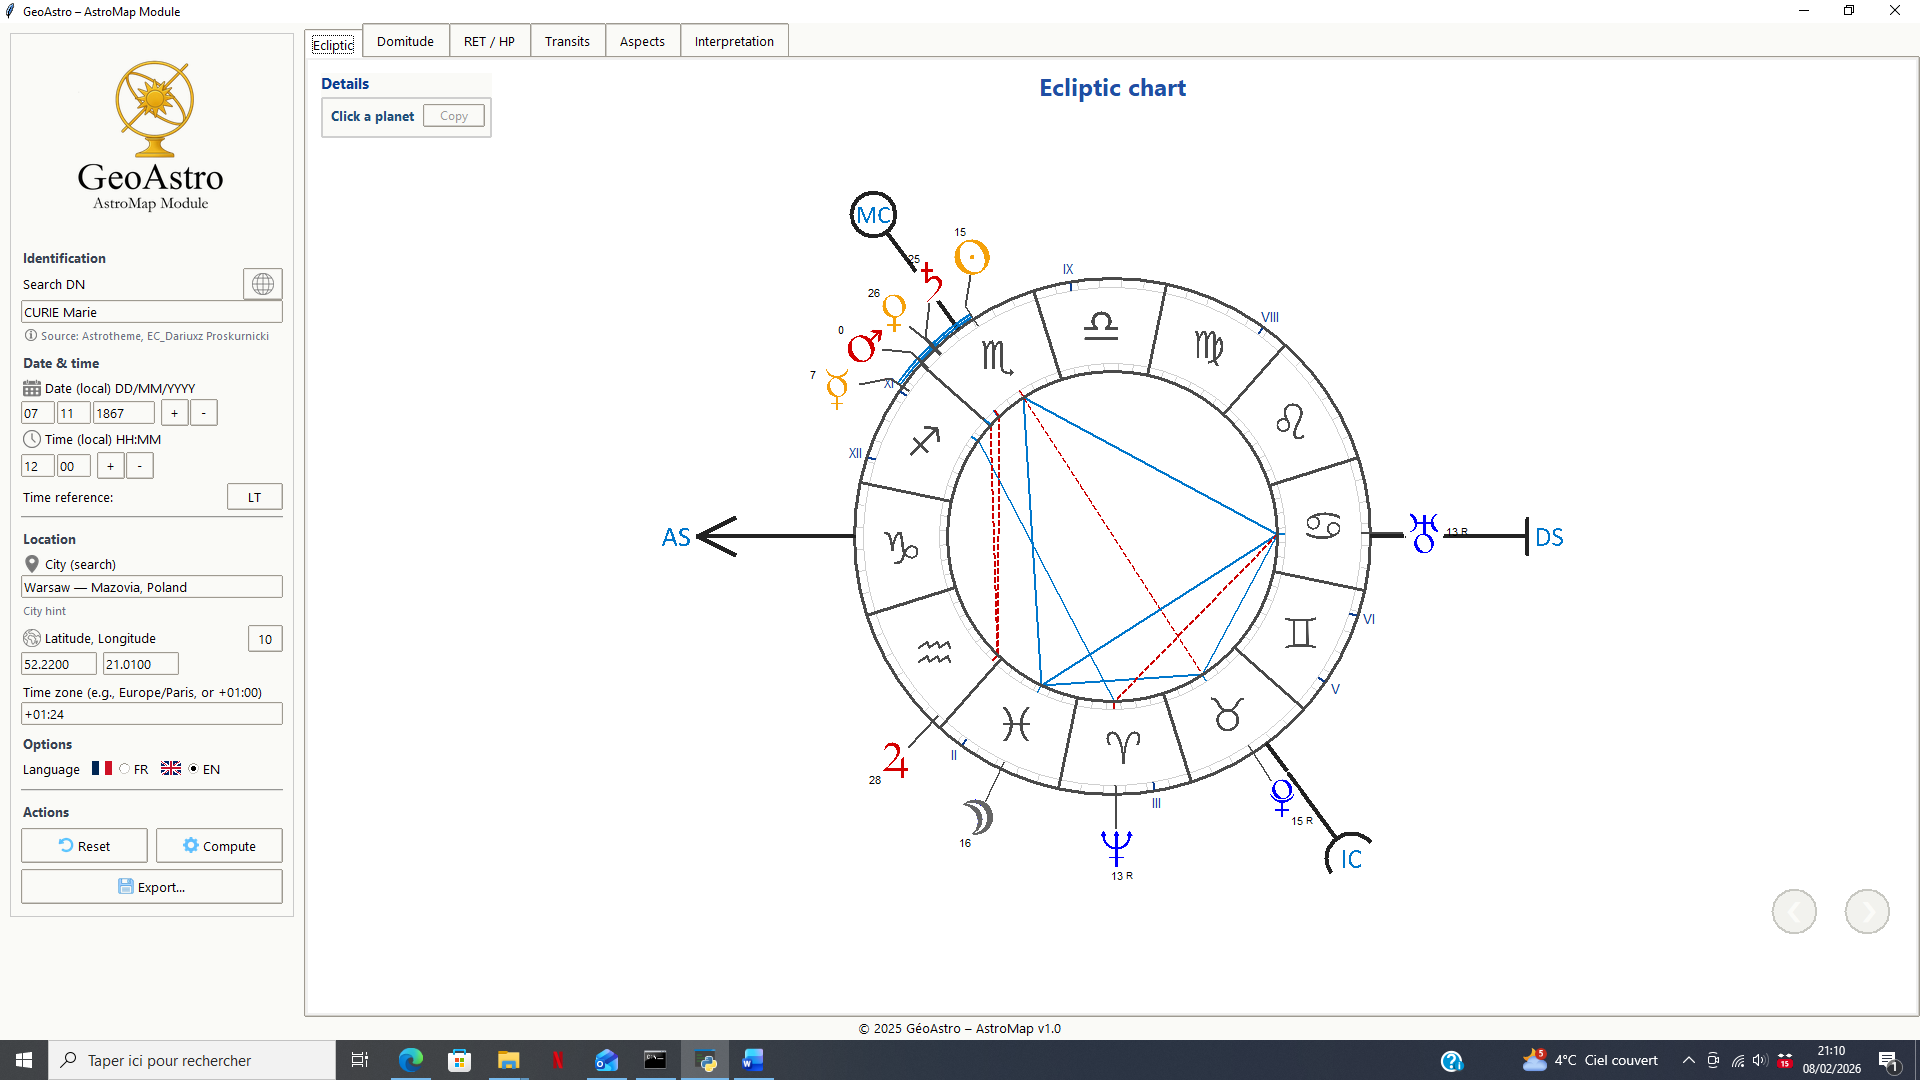
Tab 1 — Ecliptic Chart
The first tab displays the classical ecliptic astrological chart, based on the zodiacal longitudes of the planets.
It serves as:
- the visual entry point of the chart,
- a standard zodiacal reference,
- a common reading framework, independent of any hierarchical assessment.
AstroMap allows users to display either the chart of a public figure selected from a natal database or that of an individual entered manually using date, time, and place of birth.
The personalities available rely on an extensive natal data archive, including more than 8,000 birth charts originally compiled by Xavier Ego. This historical database has been progressively expanded and is intended to continue growing.
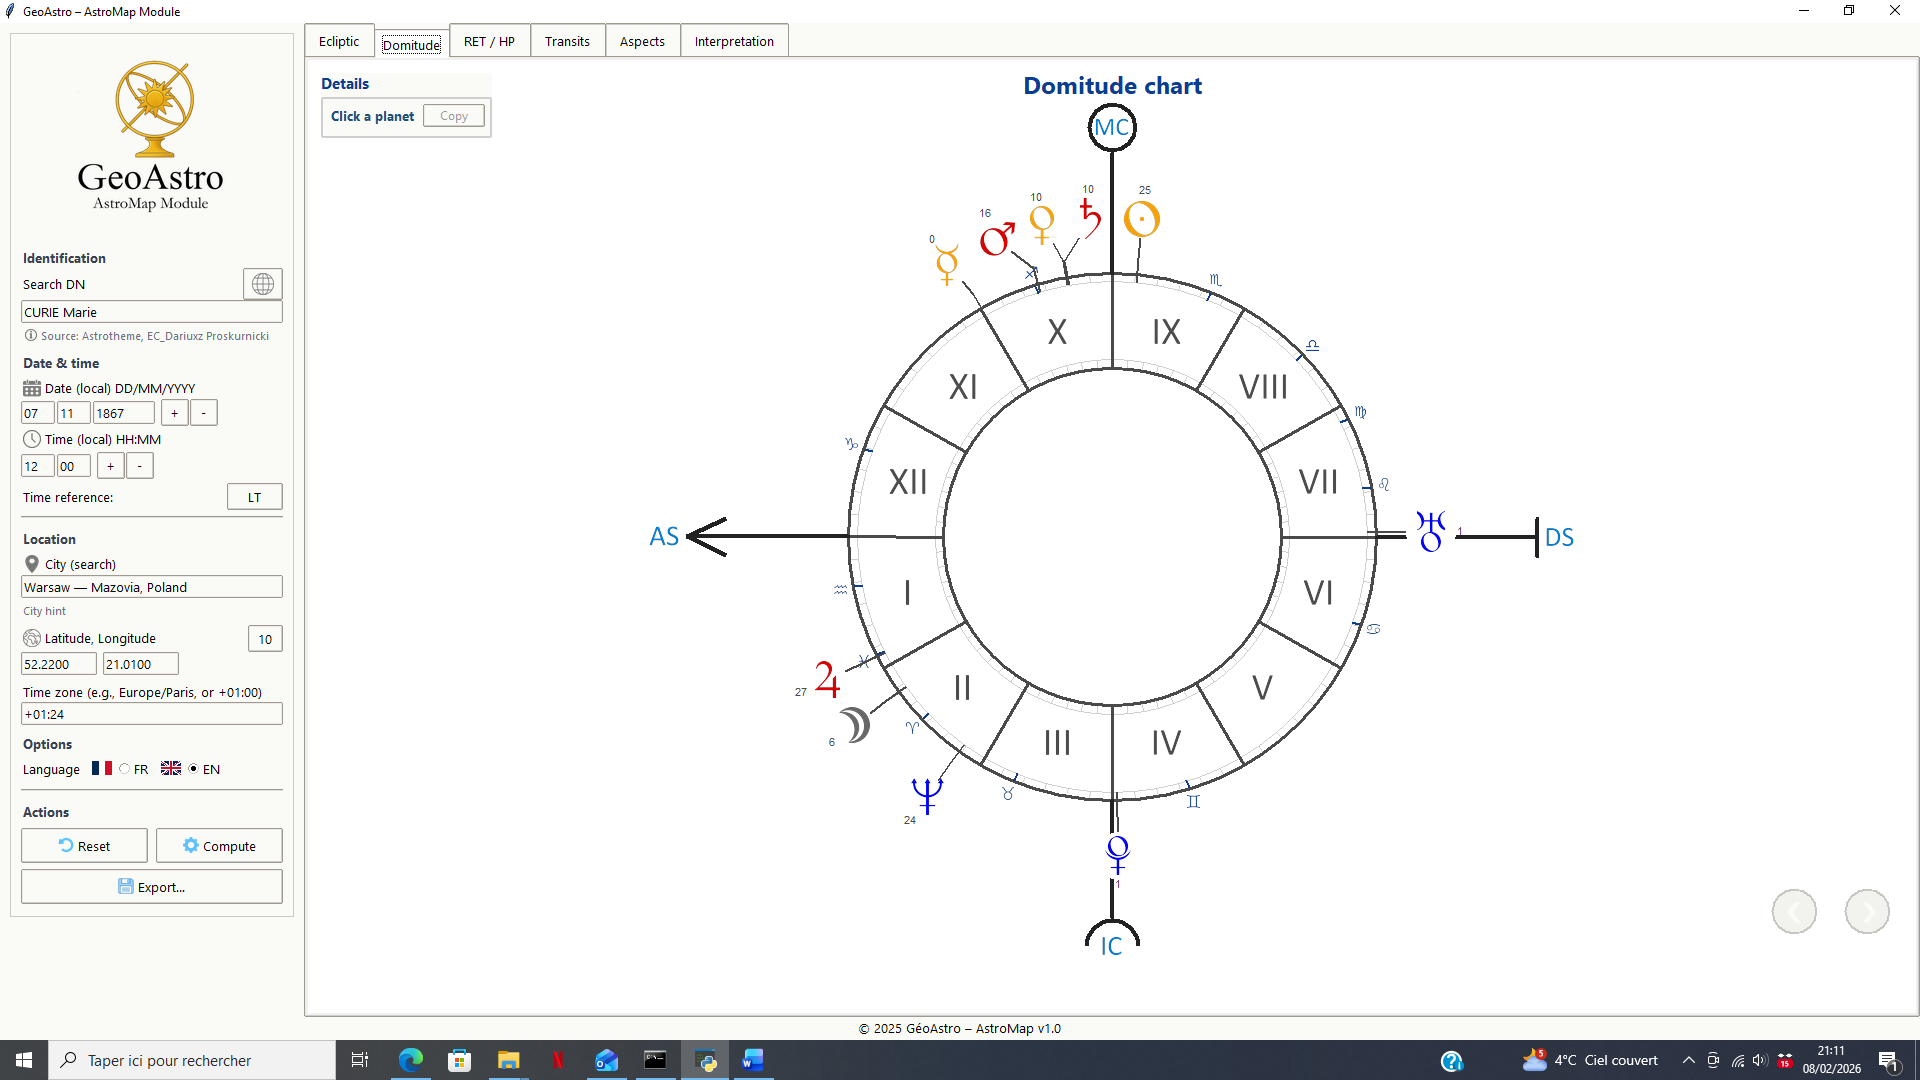
Tab 2 — Domitude Chart
The second tab presents the chart projected in real domitude, based on the local sphere, allowing planets to be located in relation to axes and houses.
This chart constitutes the actual foundation of the angularity protocol, enabling:
- the identification of the effective proximity of planets to the local axes (Ascendant, Midheaven, Descendant, Imum Coeli),
- the determination of their inclusion within the angular zones defined by the protocol.
All subsequent hierarchical calculations rely exclusively on this representation in real domitude.
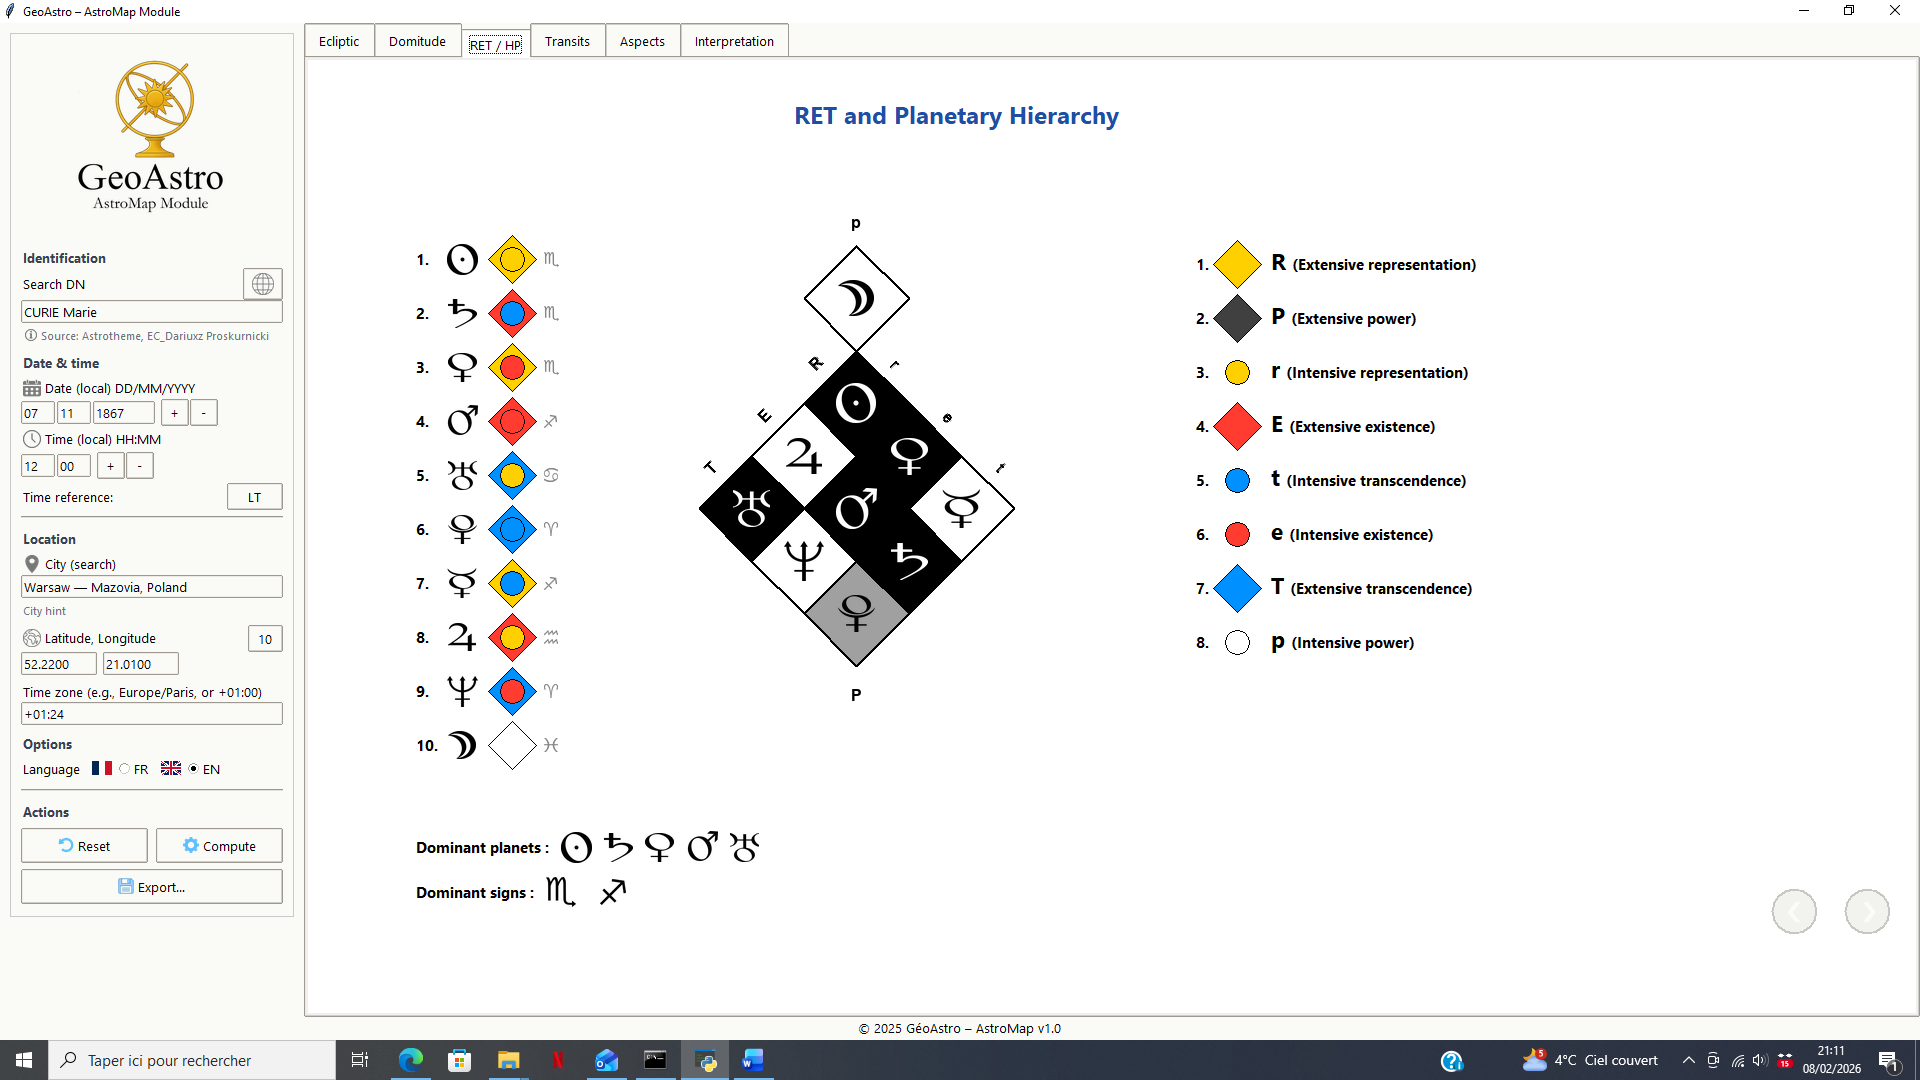
Tab 3 — RET and Planetary Hierarchy
The output is an ordered planetary hierarchy, subsequently transposed into the R.E.T. families (Representation, Existence, Transcendence), according to coherent and reproducible rules.
The dominant zodiac signs in the chart are also indicated.
A graphical synthesis is displayed in the form of the R.E.T. diamond, visually distinguishing:
- dominant planets,
- sub-dominant planets,
- non-dominant planets.
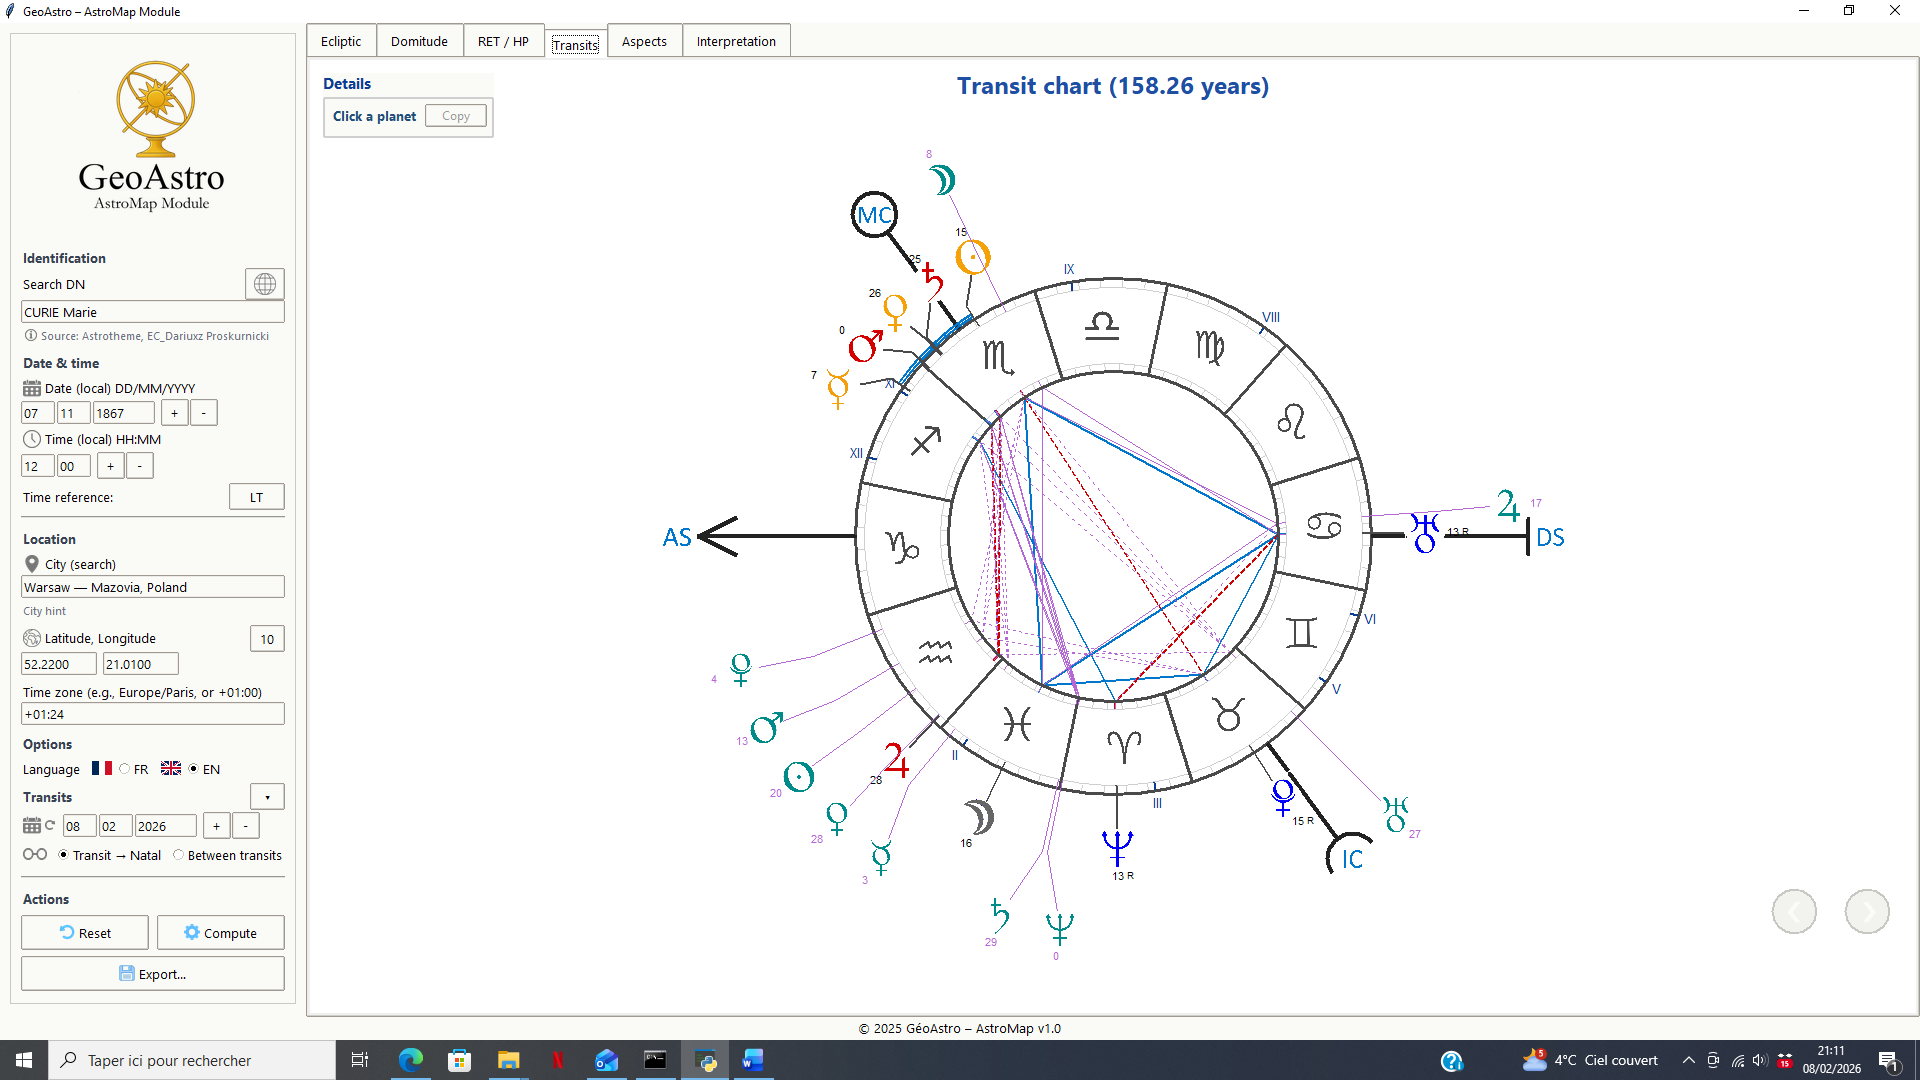
Tab 4 — Transits
The Transits tab allows the examination of planetary positions at a given moment relative to the natal chart.
It highlights the possible proximity of transiting planets to the axes of the natal chart, as well as the aspects they form with natal planets, calculated in the local sphere.
This provides a coherent reading of transits, strictly based on the same representational principles used for the natal chart.
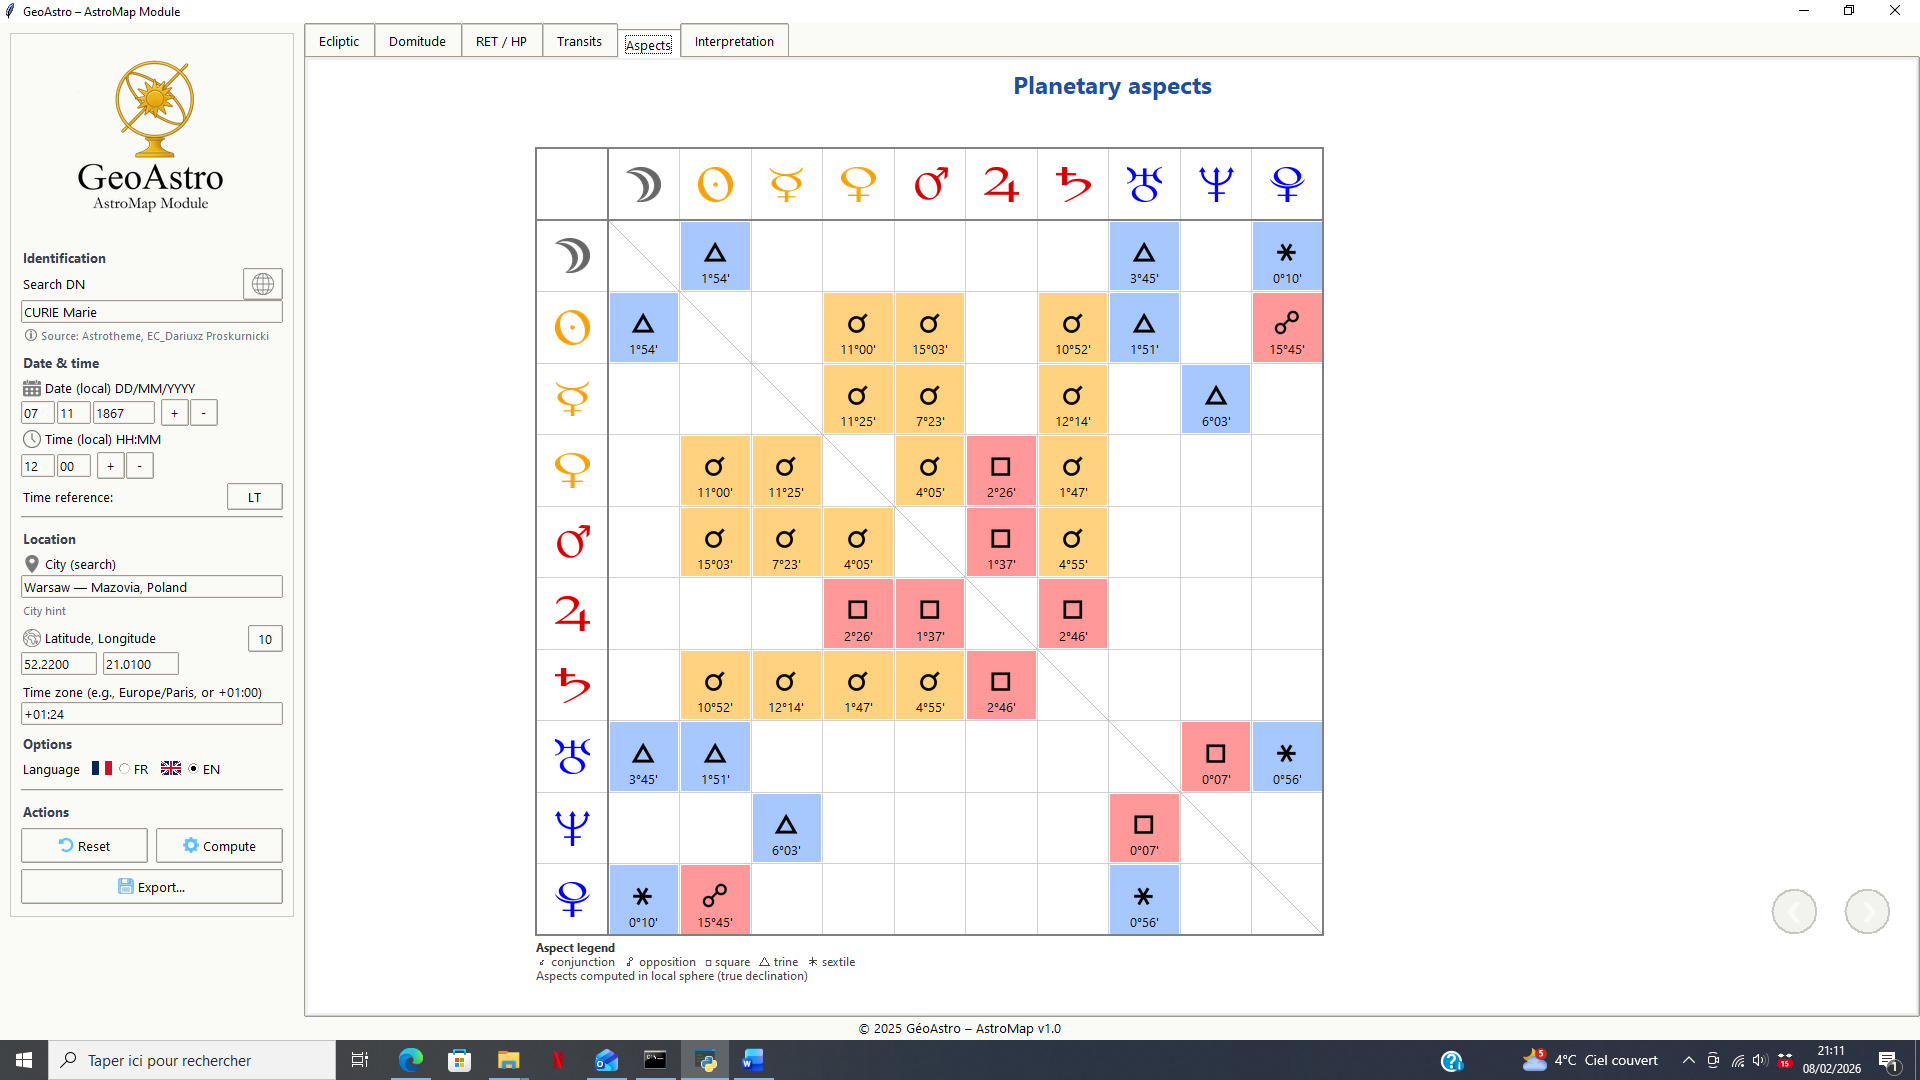
Tab 5 — Aspects
This tab displays a synthetic matrix of planetary aspects, calculated from actual positions in the local sphere.
Aspects are evaluated using differentiated orbs depending on planetary groups. This matrix functions as a reading and verification tool, but not as an autonomous criterion: aspects only acquire hierarchical significance in relation to the planets they connect.
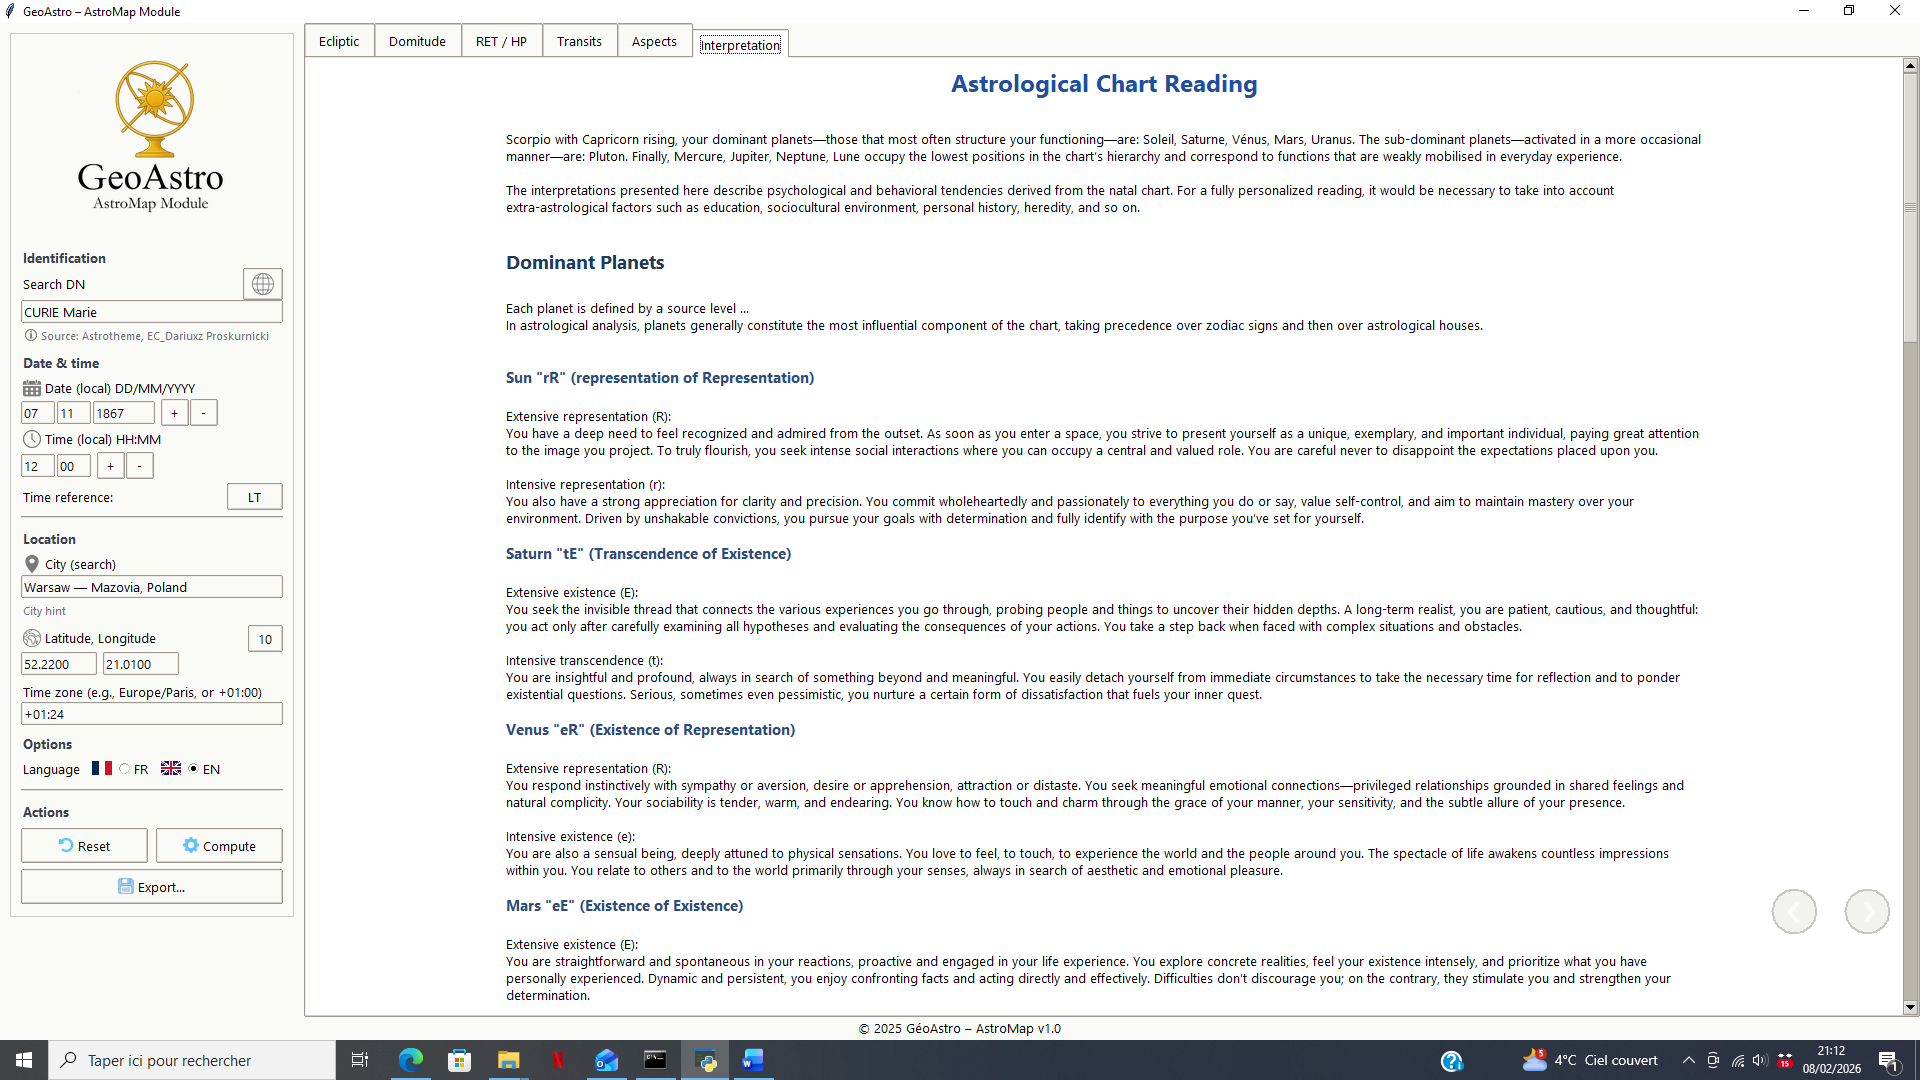
Tab 6 — Interpretation
The final tab offers an interpretative reading derived directly from the computed hierarchies.
The displayed texts are generated from:
- dominant and sub-dominant planets,
- dominant R.E.T. families,
- dominant zodiac signs.
No interpretative rules are added retrospectively: interpretation relies exclusively on the results produced by the hierarchical calculation engine.
Conclusion — Positioning of AstroMap
AstroMap is a tool for the structuring and hierarchical organization of individual astrological charts, grounded in an explicit and reproducible methodological framework.
It provides an organized representation of chart elements designed to facilitate observation, analysis, and interpretation, while ensuring the internal coherence of the hierarchies established.